artemishunts200
- 4
- 0
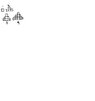
Please help! I'm stuck on modeling the function for the # of toothpicks in the nth figure. Thank you so much. Renee
The discussion revolves around modeling the number of toothpicks required to construct a sequence of stacked square figures. Participants explore the relationship between the figure number (n) and the total number of toothpicks used, considering various arrangements and layers of squares.
While there is a general agreement on the approach to modeling the problem, multiple interpretations of the arrangement of squares and the resulting calculations exist. The discussion includes various proposed formulas and methods, indicating that no single consensus has been reached.
Participants note that the arrangement of squares affects the total number of toothpicks, and there are unresolved aspects regarding the specific configurations used in the figures. The derivation of the quadratic function relies on assumptions about the sequence of toothpicks that may not be universally applicable.
This discussion may be useful for individuals interested in mathematical modeling, particularly in combinatorial geometry or sequences involving geometric arrangements.