Dustinsfl
- 2,217
- 5
First create the function file and name it whatever you would like. I prefer phase-portrait.
Then create the function file F. The reason you wan to name it F is because that is what it is referred to as in the phase portrait file
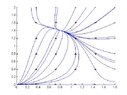
In this example, y(1) is my x and y(2) is my y. Then in the Matlab window enter in
The output will be
View attachment 388
Code:
% Phase Plot Program
% To use this function, do the following:
% >> phase_portrait(x1, x2, y1, y2, tfinal, 'F', N);     for example,
% >> phase_portrait(-5, 5, -5, 5, 10, 'F', 5)function [] = phase(x1, x2, y1, y2, tfinal, F, N); %   x1 is the x-min value
%   x2 is the x-max value
%   y1 is the y-min value
%   y2 is the y-max value
%   tfinal is the length of time interval
%   F is the system function input as a string 'F'
%   NxN: is the number of orbits plottedfigure; hold on;axis([x1 x2 y1 y2]);
Options = odeset('RelTol', 1e-6, 'AbsTol', [1e-10 1e-10]);
dx=(x2-x1)/N; dy=(y2-y1)/N;
x=x1:dx:x2; y=y1:dy:y2;
for i=1:length(x)
    for j=1:length(y)
        Y0=[x(i);y(j)];
        grad=feval(F,0,Y0);
        plot_arrow(Y0,grad,x2-x1,y2-y1,'r');
        [T Y] = ode45(F, [0 tfinal], Y0, Options);
        plot(Y(:,1),Y(:,2));
        [T Y] = ode45(F, [0 -tfinal], Y0, Options);
        plot(Y(:,1),Y(:,2));
    end
endfunction [] = plot_arrow(pnt,grd,xlngth,ylngth,c)%put arrowhead on trajectory to indicate direction
%arrowhead is not scaled to indicate velocity
%so all arrowheads are the same size
%pnt is a point as a vector, [x y]
%grd is the gradient of the trajectory at pnt, e.g.[1 .5]
%c is the color of the arrowhead as a stringnrm=norm(grd); %get norm of gradient
scaler=min(abs(xlngth),abs(ylngth)); %get length of shorter axis
if nrm>1e-6 %don't put arrows at fixed points
    grd=.02*scaler*grd./nrm; %scale norm of gradient to axes
    A=[0 -1;1 0]; %90 degree rotation matrix
    rgrd=A*grd; %a vector perp to gradient
    h=pnt+.5*grd; %the point of the arrow head
    tb=pnt-.5*grd+.5*rgrd; %the top of the base of the arrow head
    bb=pnt-.5*grd-.5*rgrd; %the bottom of the base of the arrow head
    xs=[h(1);tb(1);bb(1)]; %x values of arrow head vertices
    ys=[h(2);tb(2);bb(2)]; %y values of arrow head vertices
    patch(xs,ys,c); %draw the arrow head
end
Then create the function file F. The reason you wan to name it F is because that is what it is referred to as in the phase portrait file
Code:
function yprime = F(t,y);
yprime(1) = y(1)*(3 - 2*y(1) - 1*y(2));
yprime(2) = y(2)*(5-1*y(1)-3*y(2));

yprime = yprime';
In this example, y(1) is my x and y(2) is my y. Then in the Matlab window enter in
Code:
phase_portrait(0, 1.8, 0, 2, 7, 'F', 5)The output will be
View attachment 388