Vibrational Modes: How They Affect Motion

  • Thread starter Thread starter Kajan thana
  • Start date Start date
  • Tags Tags
    Modes
Click For Summary
SUMMARY

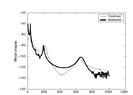
The discussion centers on the analysis of vibrational modes in a Bimorph beam (PEH) using accelerometer data. The "Predicted" graph was generated through Finite Element Analysis (FEA) tools, while the "Measured" graph represents actual data collected from the system. The data acquisition involved exciting the MEMS arm with a high mechanical impedance source and sweeping the frequency to obtain the vibrational response, akin to plotting the transfer function of a 2-port network.

PREREQUISITES
  • Understanding of vibrational modes and their significance in mechanical systems
  • Familiarity with Finite Element Analysis (FEA) tools
  • Knowledge of accelerometer data acquisition techniques
  • Basic principles of transfer functions in network analysis
NEXT STEPS
  • Research advanced Finite Element Analysis (FEA) techniques for vibrational analysis
  • Explore methods for optimizing accelerometer data collection
  • Learn about mechanical impedance and its effects on vibrational modes
  • Study the principles of transfer functions in greater detail
USEFUL FOR

Engineers, researchers, and students involved in mechanical design, vibration analysis, and sensor technology will benefit from this discussion.

Kajan thana
Messages
149
Reaction score
18
TL;DR
I understand the basic meaning of vibrational mode. Could someone interpret what this graph means?
1637767754603.png

Ps: It is not a homework hence why I did not leave it under that headline.
 

Attachments

  • 1637767671004.png
    1637767671004.png
    7.6 KB · Views: 136
Engineering news on Phys.org
What is the test setup? Is this accelerometer data?
 
This data is on Bimorph beam (PEH)...
 
Kajan thana said:
This data is on Bimorph beam (PEH)...
Oh, like this: https://www.google.com/url?sa=t&rct.../8/4/645/pdf&usg=AOvVaw2DBGVt6_5h1-fJ0Yv-EqoI

Kajan thana said:
Summary:: I understand the basic meaning of vibrational mode. Could someone interpret what this graph means?
So the "Predicted" graph was likely plotted using FEA tools, and the "Measured" graph was plotted directly from the acquired data. Presumably they were exciting the MEMS arm with a high mechanical impedance source and sweeping the frequency of that source to get the plot. Similar to how you plot the transfer function of a 2-port network...
 
  • Like
Likes Kajan thana
Thank you so much
 

Similar threads

Replies
13
Views
3K
Replies
6
Views
2K
  • · Replies 6 ·
Replies
6
Views
2K
  • · Replies 7 ·
Replies
7
Views
3K
Replies
8
Views
3K
  • · Replies 13 ·
Replies
13
Views
4K
  • · Replies 4 ·
Replies
4
Views
3K
  • · Replies 4 ·
Replies
4
Views
5K
  • · Replies 0 ·
Replies
0
Views
1K
  • · Replies 1 ·
Replies
1
Views
1K