mintsharpie
- 3
- 0
Please help me with multiple comparisons - urgent (stats)
Hello, I just have a quick question understanding multiple comparisons and I'd appreciate any help because I'm on the verge of failing I'm reviewing for a test, and reading over questions and their corresponding answers in the back of the textbook. The question I'm stuck on deals with a psychologist testing the claim made by a drug company that a drug would help patients.
To do this, they selected 20 patients from their hospital, and randomly assigned them to one of four groups - group 1 receiving the new drug, group 2 receiving a different drug, group 3 receiving a different drug, and group 4 as the control group. Here is the answer given in the textbook:
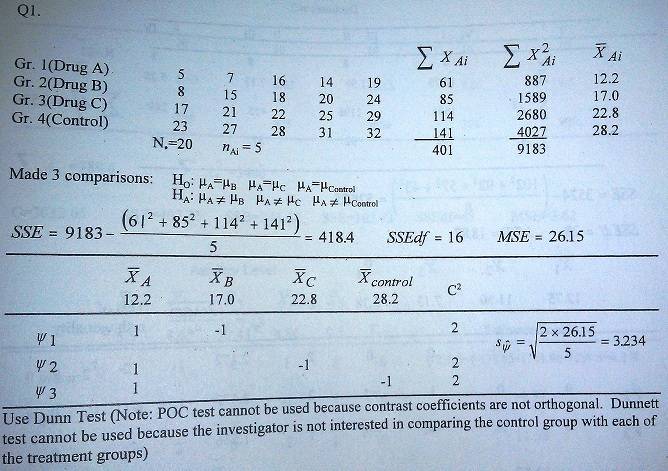
I understand the first part, and how SSE is calculated and everything, but the second table with the contrasts totally baffles me. I have no idea how that table was filled in, or how I would be able to fill it in on a test if I had a different example. How were those 1s, -1s, and 2s determined? What do they mean and how were they calculated? In addition, once I go on to the appropriate post hoc test - in this case, Dunn - how do I utilise the table in terms of critical values?
Please help me, I'm so very lost!
Hello, I just have a quick question understanding multiple comparisons and I'd appreciate any help because I'm on the verge of failing
I'm reviewing for a test, and reading over questions and their corresponding answers in the back of the textbook. The question I'm stuck on deals with a psychologist testing the claim made by a drug company that a drug would help patients.To do this, they selected 20 patients from their hospital, and randomly assigned them to one of four groups - group 1 receiving the new drug, group 2 receiving a different drug, group 3 receiving a different drug, and group 4 as the control group. Here is the answer given in the textbook:
I understand the first part, and how SSE is calculated and everything, but the second table with the contrasts totally baffles me. I have no idea how that table was filled in, or how I would be able to fill it in on a test if I had a different example. How were those 1s, -1s, and 2s determined? What do they mean and how were they calculated? In addition, once I go on to the appropriate post hoc test - in this case, Dunn - how do I utilise the table in terms of critical values?
Please help me, I'm so very lost!
