Discussion Overview
The discussion revolves around the graph of a vector equation given by \( r(t) = e^{2t} \mathbf{i} + e^{r} \mathbf{j} \). Participants explore the nature of the curve, potential relationships between the components, and the implications of the graph's shape.
Discussion Character
- Exploratory
- Mathematical reasoning
- Debate/contested
Main Points Raised
- Initial inquiry about the graph of the vector equation and whether a simpler equation can be derived.
- Some participants suggest that the y-component should be \( e^t \) instead of \( e^r \), leading to a potential relationship where \( x = e^{2t} \) and \( y = e^t \).
- A participant proposes the relationship \( x = y^2 \) based on the corrected components.
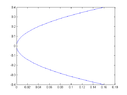
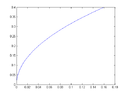
- Discussion about the meaning of a red line in an attached graph, with clarification that it is imaginary and should be ignored, while the blue part represents \( x = y^2 \).
- Concerns are raised about the possibility of \( y = e^t \) being negative, prompting further reflection on the nature of the graph.
- Participants share graphical outputs from MATLAB, expressing uncertainty about the accuracy of their results.
Areas of Agreement / Disagreement
There is no consensus on the implications of the graph or the nature of the components, as participants express differing views on the y-component and its relationship to the x-component.
Contextual Notes
Participants have not fully resolved the implications of the vector equation, particularly regarding the y-component and its potential negative values. The discussion includes references to graphical representations that may not fully capture the mathematical relationships discussed.