SUMMARY
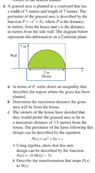
The inequality describing the region where grass has been planted is defined by the parabolic curve \( P = 5x - x^2 \) for the interval \( 0 \leq x \leq 5 \). The planted region, denoted as \( R \), is located below this curve and above the x-axis, leading to the correct representation as \( 0 \leq R \leq P \). The initial suggestion of \( P < x^2 - 5x \) is incorrect. A graph illustrating this relationship clarifies the misunderstanding regarding the shape of the planted area.
PREREQUISITES
- Understanding of parabolic equations and their graphs
- Familiarity with inequalities in mathematical contexts
- Basic knowledge of coordinate geometry
- Ability to interpret graphical representations of functions
NEXT STEPS
- Study the properties of parabolas and their applications in real-world scenarios
- Learn how to graph inequalities involving quadratic functions
- Explore the concept of regions defined by curves in coordinate geometry
- Investigate the use of graphing tools to visualize mathematical functions
USEFUL FOR
Students studying algebra, mathematics educators, and anyone interested in understanding the graphical representation of inequalities and parabolic functions.