Swamp Thing
- 1,076
- 848
- TL;DR
- Plotting Arg[ f[x] ] gives output that has jumps of +/- 2Pi and is limited to +-Pi.
Can we unwrap this into a jumpless plot?
This discussion https://community.wolfram.com/groups/-/m/t/1340126 includes some ideas to unwrap a list of wrapped-around values such as phase (e.g. Arg[ f[N] ] ). You can use this to ListPlot a jump-free graph.
I'm trying to adapt this to work in Plot rather than ListPlot. The idea is to plot fnUnwrap [ myPhase[t] ], where fnUnwrap is called whenever the plotter wants to evaluate the Y value.
Now fnUnwrap needs to use two successive phase values, and also maintain a cumulative total of all the jumps. So we store some "state information" in the variables unwrap`old and unwrap`cumu, i.e. the previous input and the accumulated jumps. Here is my attempt:
This code "sort of" works, but has these spikes around the jump points and has an offset as well:
Output:
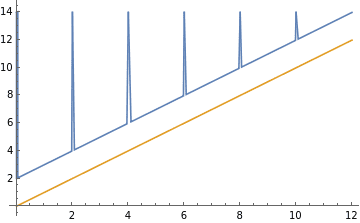
Can this be fixed , or is there a better approach?
I'm trying to adapt this to work in Plot rather than ListPlot. The idea is to plot fnUnwrap [ myPhase[t] ], where fnUnwrap is called whenever the plotter wants to evaluate the Y value.
Now fnUnwrap needs to use two successive phase values, and also maintain a cumulative total of all the jumps. So we store some "state information" in the variables unwrap`old and unwrap`cumu, i.e. the previous input and the accumulated jumps. Here is my attempt:
Code:
fnUnwrap2[new_,\[CapitalDelta]_,tol_]:=Module[{jmp},
                                    jmp=new-unwrap`old;
                                    jmp=-Sign[jmp] Unitize[        Chop [ Abs[jmp],tol      ]   ];
                                    jmp= jmp *  \[CapitalDelta];
                                    unwrap`cumu=unwrap`cumu+jmp;
                                    unwrap`old=new;
                                    new + unwrap`cumu
                                                                                  ]
This code "sort of" works, but has these spikes around the jump points and has an offset as well:
Code:
unwrap`old=0
unwrap`cumu=0

Plot[{ fnUnwrap2[Mod[ x, 2],2,1.75],
           x

    },{x,0,12},PlotRange->All,PlotPoints->250]
Output:
Can this be fixed , or is there a better approach?
Last edited: