Can't we use linear regression for classification/prediction?

Join the discussion
Ask a follow-up here, or get your own question answered by working scientists, mathematicians and engineers — people, not an autocomplete.
Real named experts · corrections over time · the nuance an AI answer skips
7 replies · 1K views
shivajikobardan
Messages
637
Reaction score
54
Homework Statement
difference between logistic and linear regression.
Relevant Equations
none
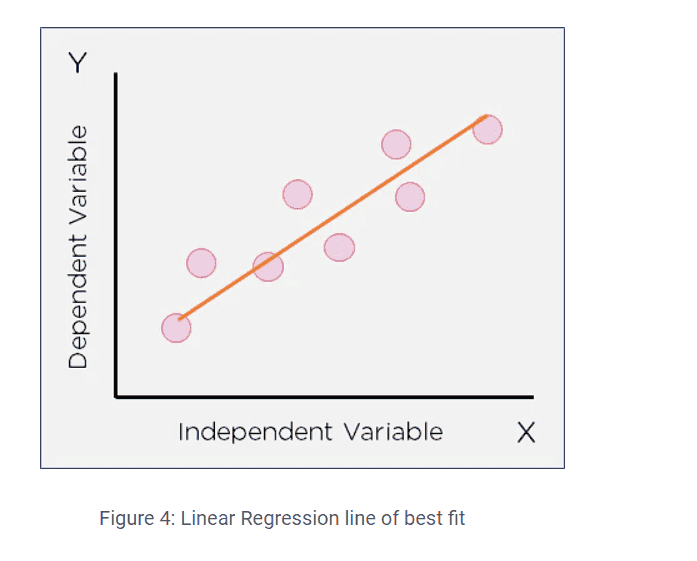
they say that linear regression is used to predict numerical/continuous values whereas logistic regression is used to predict categorical value. but i think we can predict yes/no from linear regression as well
1651852382099.png


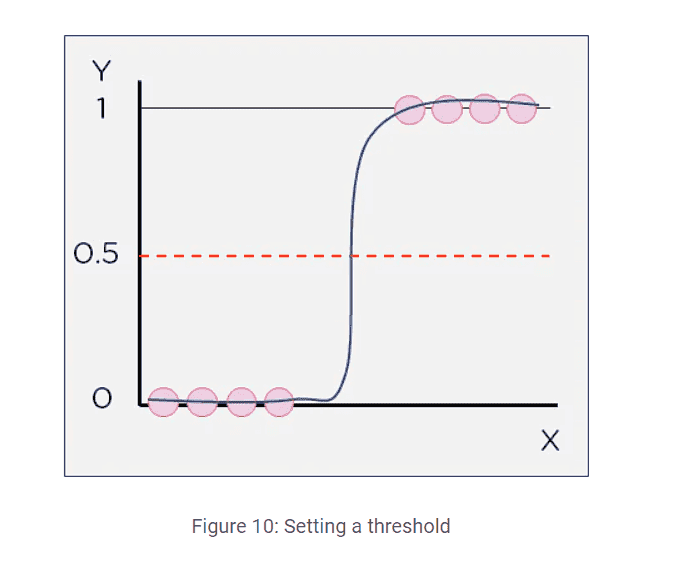
Just say that for x>some value, y=0 otherwise, y=1. What am I missing? What is its difference with this below figure?
1651852434225.png
 
Physics news on Phys.org
Branching can have profound effects on performance: for example, the overhead of accessing code modules not currently quickly available after an if/then/else branch. It not as as simple as you might think a priori. Complicated data analysis like you present can have this kind of problem too.

Here is a somewhat dated, but still very important read from Ulrich Drepper:
https://www.akkadia.org/drepper/cpumemory.pdf

I am sure someone will spout reasons why it is "bad", but your question is down in the weeds and low level db programmers are down there in the weeds with you and have to mess with branching effects all the time. I concede that very high level programming platforms can negate some of this. But the question asked above still remains for us weedy types.

Posted in error.
 
Last edited:
shivajikobardan said:
What is its difference with this below figure?
Are you joking? One is a straight line (hence linear regression), the other is an s-curve.

The second plot is a terrible example of a threshold curve BTW - the input data points should not all be 0 or 1 because in that case there is no need to apply the threshold.
 
pbuk said:
Are you joking? One is a straight line (hence linear regression), the other is an s-curve.
Ofc I get that. What I am trying to say is why can't we say if x>0.5, y=1 else y=0?
pbuk said:
The second plot is a terrible example of a threshold curve BTW - the input data points should not all be 0 or 1 because in that case there is no need to apply the threshold.
 
shivajikobardan said:
Ofc I get that. What I am trying to say is why can't we say if x>0.5, y=1 else y=0?
You can use linear regression with nonlinear functions as long as the form of the model has the parameters of the linear regression in an acceptable way. The values of the nonlinear functions are the independent variables of the linear regression. i.e. ##Y = a_0 + a_1 f_1(X_1) + a_2 f_2(X_2) + \epsilon## is a model where linear regression can be used to find the ##a_i##s even if the ##f_i##s are nonlinear. The values ##z_{i,j}=f_i(x_j)## are the new independent variables.
One limitation on the use of linear regression for classification is that the classifications often can not be defined by a variable, ##X##. How can the categories (man, woman, dog, cat, duck) be defined by a real variable, ##X##?
 
Last edited: