kimchuu
- 3
- 0
Hello Everyone!
I really need help on 2 questions and it is due tomorrow! So please help me when u can and ASAP
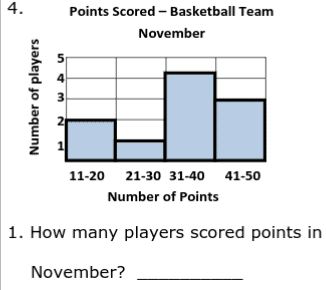
So for this one, this was easy, except for the 31-40 interval I'm not sure if it's 4.5, cause it's not necessarily exactly between and half of 4 and 5 and for the 41-50 interval I'm not sure if its actually a 3 and its somewhat confusing. Does anyone care to enlighten me?
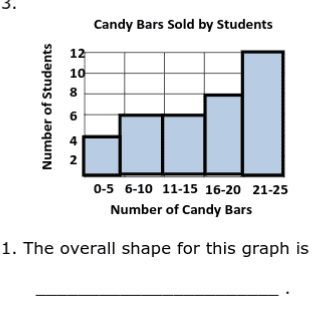
For this one, I am also confused. For my answer I believe it is approximately symmetric, you know what I did? So I did like what you usually do I add and replace the bars so all of them can look symmetric,
and then for the last one it stays as 12 and if I break/divide it by 2, you get 6, and that will be perfectly symmetric. The thing is I don't know if my thesis is correct.
PLEASE KINDLY
HELP ME ASAP
I really need help on 2 questions and it is due tomorrow! So please help me when u can and ASAP
So for this one, this was easy, except for the 31-40 interval I'm not sure if it's 4.5, cause it's not necessarily exactly between and half of 4 and 5 and for the 41-50 interval I'm not sure if its actually a 3 and its somewhat confusing. Does anyone care to enlighten me?
For this one, I am also confused. For my answer I believe it is approximately symmetric, you know what I did? So I did like what you usually do I add and replace the bars so all of them can look symmetric,
and then for the last one it stays as 12 and if I break/divide it by 2, you get 6, and that will be perfectly symmetric. The thing is I don't know if my thesis is correct.
PLEASE KINDLY
HELP ME ASAP