MHB Draw a venn diagram and include the given information

Click For Summary
The discussion revolves around creating a Venn diagram based on the medical data provided, which includes 40 clinic visitors with overlapping conditions of heart disease and diabetes. It is established that all individuals with these conditions also suffer from stress, while 3 individuals experience stress without these conditions. The calculations lead to determining the number of individuals suffering from both diseases, denoted as x, and solving the equation reveals that x equals 12. Consequently, the number of people with diabetes but without heart disease is calculated, and an updated diagram is shared to reflect these findings. The conversation emphasizes the importance of clarity in mathematical representation and corrections made during the problem-solving process.
mathlearn
Messages
331
Reaction score
0
Problem

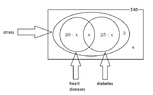
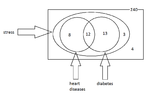
It was revealed that out of 40 persons who visited a medical clinic , 20 heart diseases and 25 had diabetes. All those who had heart diseases and all those had diabetes suffered from stress too. 3 persons suffered from stress only had 4 persons did not suffer from stress.

i.Draw a Venn Diagram to depict this information and write down in it , the number of elements belonging to each region.

ii.How many persons had diabetes but did not have heart diseases

Workings

Okay So this is how a picture the Venn diagram should be.

View attachment 6057

Many Thanks (Happy)
 

Attachments

  • venn diagram.png
    venn diagram.png
    7.1 KB · Views: 137
Mathematics news on Phys.org
We aren't given how many suffer both from heart disease AND diabetes, so we'll call that number $x$ and then fill in what we do know:

View attachment 6058

Now, we know the sum of all the areas is 40, so we may write:

$$(20-x)+x+(25-x)+3+4=40$$

Now, we just need to solve for $x$...(Thinking)
 

Attachments

  • mathlearnvenn_2.png
    mathlearnvenn_2.png
    9.2 KB · Views: 125
MarkFL said:
We aren't given how many suffer both from heart disease AND diabetes, so we'll call that number $x$ and then fill in what we do know:

Now, we know the sum of all the areas is 40, so we may write:

$$(20-x)+x+(25-x)+3+4=40$$

Now, we just need to solve for $x$...(Thinking)

Thank you very much (Happy)(Party)

$$(20-x)+x+(25-x)+7=40$$
$$(20)+(25-x)+7=40$$
$$(52-x)+7=40$$
$$-x=40-52$$
$$x=12$$

Now I updated the Diagram,

https://www.physicsforums.com/attachments/6059._xfImport

Many Thanks :)

Update :I have started a new thread for the second part of this question :http://mathhelpboards.com/pre-algebra-algebra-2/part-2-draw-venn-diagram-include-given-information-19726.html#post90091
 

Attachments

  • venn diagram.png
    venn diagram.png
    7.5 KB · Views: 108
Good job! (Star)

In the future, it's okay to post a follow-up question in the same thread (a question that pertains to the original question), we just don't want completely new questions tagged onto an existing thread. :D
 
mathlearn said:
Thank you very much (Happy)(Party)

$$(20-x)+x+(25-x)+7=40$$
$$(20)+(25-x)+7=40$$
$$(52-x)+7=40$$
The "+ 7" here is wrong. That 7 is already included in the "52".

$$-x=40-52$$
That error was corrected here.

$$x=12$$

Now I updated the Diagram,
Many Thanks :)

Update :I have started a new thread for the second part of this question :http://mathhelpboards.com/pre-algebra-algebra-2/part-2-draw-venn-diagram-include-given-information-19726.html#post90091
 
HallsofIvy said:
The "+ 7" here is wrong. That 7 is already included in the "52". That error was corrected here.

(Happy) (Smile) (Party) Thanks for the catch
 

Similar threads

  • · Replies 6 ·
Replies
6
Views
2K
  • · Replies 4 ·
Replies
4
Views
2K
  • · Replies 3 ·
Replies
3
Views
2K
Replies
3
Views
12K
  • · Replies 6 ·
Replies
6
Views
2K
  • · Replies 8 ·
Replies
8
Views
2K
  • · Replies 1 ·
Replies
1
Views
4K
  • · Replies 47 ·
2
Replies
47
Views
9K
  • · Replies 17 ·
Replies
17
Views
2K
  • · Replies 33 ·
2
Replies
33
Views
4K