maximus123
- 48
- 0
Hello,
I have to estimate some values from a plot (shown in the attachment). The trouble is I'm not sure how to read one of the scales
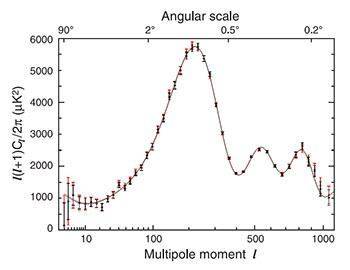
could someone please explain the nature of the scale along the top frame, the angular scale, i.e how it is spaced. One of my aims is to estimate which angle, roughly, the first peak corresponds to but I don't understand how the values between the 2 degrees and 0.5 degrees are spaced.
Thanks a lot
P.S the plot was taken from a technical paper regarding results from the WMAP experiment, which can be found at http://map.gsfc.nasa.gov/news/tp_links.html
I have to estimate some values from a plot (shown in the attachment). The trouble is I'm not sure how to read one of the scales
could someone please explain the nature of the scale along the top frame, the angular scale, i.e how it is spaced. One of my aims is to estimate which angle, roughly, the first peak corresponds to but I don't understand how the values between the 2 degrees and 0.5 degrees are spaced.
Thanks a lot
P.S the plot was taken from a technical paper regarding results from the WMAP experiment, which can be found at http://map.gsfc.nasa.gov/news/tp_links.html