Discussion Overview
The discussion revolves around graphing the distance versus time for a commuting student who forgets a term paper. Participants explore the steps to create the graph, the implications of the student's changing speed, and the interpretation of slope in the context of the problem.
Discussion Character
- Exploratory
- Technical explanation
- Mathematical reasoning
Main Points Raised
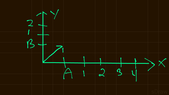
- A student drives 27 miles to college and realizes they forgot a term paper, prompting a return home.
- Participants discuss how to represent time and distance on the graph, suggesting a linear function.
- Some participants express uncertainty about the initial steps and the implications of the student's speed changes.
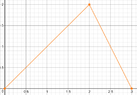
- Questions arise about how the graph changes direction when the student returns home at a faster speed.
- Participants analyze the meaning of points on the graph, specifically how they represent the student's distance from home over time.
- There is a discussion about the slope of the graph, particularly how it becomes negative when the student returns home.
- One participant attempts to calculate the slope using points on the graph, leading to confusion about the correct interpretation of steepness.
- Another participant corrects a misunderstanding regarding the slope's sign, emphasizing that it should be negative as the distance decreases.
Areas of Agreement / Disagreement
Participants express various viewpoints on how to approach the graphing problem, with some uncertainty about the implications of speed changes and slope calculations. There is no consensus on the final representation of the graph or the interpretation of the slope.
Contextual Notes
Participants note the lack of specific information about the time spent driving before realizing the paper was forgotten, which affects the graph's accuracy. There are also unresolved questions about the calculations related to slope and the representation of distance and time.
Who May Find This Useful
This discussion may be useful for students learning about graphing functions, particularly in the context of real-world scenarios involving distance and time. It may also benefit those exploring the concepts of slope and speed in mathematical contexts.