BTH
- 2
- 0
Hi All,
This may not be the correct sub-forum in which to post this question and probably a very simple question, so I apologize in advance. I was analyzing some data for a project and noticed I was getting the same result from different calculations on the data-set and am very curious as to why! I've restated the scenario in a simplified example and am hoping someone with more of a math background than me can provide the mathematical explanation.
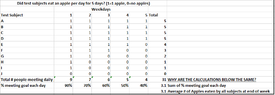
Scenario: A group of 10 people are asked to attempt eating at least 1 apple each day for 5 days. At the end of 5 days, the researcher looks at the data to determine what percentage of the group met the goal each day, as well as the total number of apples eaten by each test subject over the 5 day period. When I sum the % of total test subjects who ate an apple each day and also average the total number of apples eaten over the week by all subjects, the results are the same. The calculated data is pasted below.
View attachment 7677
This may not be the correct sub-forum in which to post this question and probably a very simple question, so I apologize in advance. I was analyzing some data for a project and noticed I was getting the same result from different calculations on the data-set and am very curious as to why! I've restated the scenario in a simplified example and am hoping someone with more of a math background than me can provide the mathematical explanation.
Scenario: A group of 10 people are asked to attempt eating at least 1 apple each day for 5 days. At the end of 5 days, the researcher looks at the data to determine what percentage of the group met the goal each day, as well as the total number of apples eaten by each test subject over the 5 day period. When I sum the % of total test subjects who ate an apple each day and also average the total number of apples eaten over the week by all subjects, the results are the same. The calculated data is pasted below.
View attachment 7677