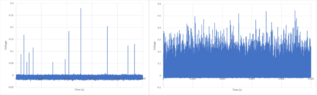
How best to statistically analyse a PMT signal?

  • B
  • Thread starter rwooduk
  • Start date
  • Tags
    Signal
In summary, the conversation discusses collecting photomultiplier tube (PMT) tube data and the best way to analyze it. The person asking the questions is interested in getting the relative total intensity and other statistical analysis. Another person suggests using a correlation detector and mentions that a PMT may not always be the best choice. The conversation also briefly mentions using synchronous detection with a modulated source for remission signals and asks for more information on the apparatus being used. The original question is about the analysis of various aspects of the PMT data, such as leading edge, gain, quantum efficiency, and dark current.
  • #1
rwooduk
762
59
TL;DR Summary
I am looking for advice on statistical analysis of a PMT signal
Hello,

I have recently started collecting photomultiplier tube (PMT) tube data, and I'm curious how best to analyse it (attached right). I also have a background capture (attached left). I am looking to get the relative total intensity and any other statistical analysis I could make. Is anyone familiar with such a signal?

Thanks for any advice.
 

Attachments

  • ddd.png
    ddd.png
    8.6 KB · Views: 96
Physics news on Phys.org
  • #2
I think you could apply the two signals to a correlation detector.
 
  • Like
Likes rwooduk
  • #3
tech99 said:
I think you could apply the two signals to a correlation detector.
I don't know what this is but will look into it, many thanks.
 
  • #4
rwooduk said:
collecting photomultiplier tube (PMT) tube data
Maybe you want to reveal to us what this is all about ? What is your PMT looking at ? A scintillator, a spectrometer, something else ?

##\ ##
 
  • #5
If you are supplying the light (i.e this is a remission signal) the most common method is some form of synchronous detection with a modulated source. Not identical to background subtraction for instrumentation reasons. Also sometimes a PMT is not the best choice. What is the apparatus?
 
  • #6
He's been gone for almost a year.

My question would be "analysis of what?" Leading edge? Gain? Quantum efficiency? Dark current? The list goes on...
 
  • Like
Likes hutchphd

What is a PMT signal and why is it important to analyze it statistically?

A PMT (Photomultiplier Tube) signal refers to the output generated by a photomultiplier tube, which is a device used to detect and measure low levels of light. It is important to analyze these signals statistically to accurately interpret the light signals, which are often very weak and can be buried in noise. Statistical analysis helps in distinguishing true signals from noise, enhancing the reliability and accuracy of measurements in applications such as medical imaging, particle physics, and astronomy.

What are the common statistical methods used to analyze PMT signals?

The most common statistical methods for analyzing PMT signals include the use of histograms to visualize the distribution of signal intensities, Gaussian fitting to model the distribution of background and signal peaks, and Poisson statistics to address the discrete nature of the count data typically observed in PMT outputs. Additionally, techniques such as signal-to-noise ratio (SNR) calculation and time series analysis might be employed depending on the specific requirements of the application.

How can one handle the noise in PMT signals during statistical analysis?

Noise in PMT signals can often be addressed by implementing filtering techniques such as smoothing and averaging. Baseline subtraction is also a common method, where the average noise level is subtracted from the signal to enhance the true signal visibility. Advanced methods might include wavelet transforms, which are effective in separating noise from the signal at various scales, and machine learning algorithms that can be trained to identify and mitigate noise components from the data.

What role does calibration play in the statistical analysis of PMT signals?

Calibration is crucial in the statistical analysis of PMT signals as it ensures that the measurements are accurate and consistent. This involves adjusting the PMT response to a known standard or reference signal. Calibration helps in correcting systematic errors and improving the precision of the measurements. It also aids in comparing results from different PMTs or different experimental setups, making the statistical analysis more reliable.

How do you determine the optimal sample size for statistical analysis of PMT signals?

Determining the optimal sample size for the analysis of PMT signals generally involves considerations of the desired statistical power and the expected effect size. Statistical power analysis can be used to estimate the minimum sample size required to detect an effect of a given size with a certain degree of confidence. Additionally, pilot studies may be conducted to estimate the variability in the PMT signals, which can then inform a more precise calculation of the needed sample size.

Similar threads

  • Quantum Physics
Replies
1
Views
795
  • Sticky
  • Set Theory, Logic, Probability, Statistics
Replies
12
Views
4K
  • Set Theory, Logic, Probability, Statistics
Replies
16
Views
1K
Replies
2
Views
1K
  • Set Theory, Logic, Probability, Statistics
Replies
4
Views
1K
  • Biology and Medical
Replies
7
Views
930
  • Set Theory, Logic, Probability, Statistics
Replies
4
Views
876
  • Atomic and Condensed Matter
Replies
5
Views
2K
  • Introductory Physics Homework Help
Replies
14
Views
1K
  • Set Theory, Logic, Probability, Statistics
Replies
1
Views
690
Back
Top