Spruance
- 33
- 0
A 2,0 kg body moves along a straight line.
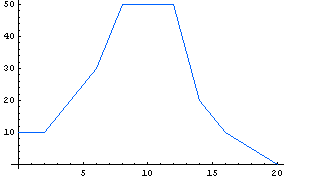
x={0,2,4,6,8,10,12,14,16,18,20} s
f(x)={10,10,20,30,50,50,50,20,10,5,0} m/s
a)
Make a acceleration-time graph
c)
Calculate the average force working on this body
x={0,2,4,6,8,10,12,14,16,18,20} s
f(x)={10,10,20,30,50,50,50,20,10,5,0} m/s
a)
Make a acceleration-time graph
c)
Calculate the average force working on this body