How do I plot a distance-time graph using TikZ?

  • Context:
  • Thread starter Thread starter mathlearn
  • Start date Start date
  • Tags Tags
    Doubt Graph Time
Join the discussion
Ask a follow-up here, or get your own question answered by working scientists, mathematicians and engineers — people, not an autocomplete.
Real named experts · corrections over time · the nuance an AI answer skips
4 replies · 2K views
mathlearn
Messages
331
Reaction score
0
Problem

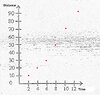
View attachment 6052

Plot the above given information in a Distance time graph.

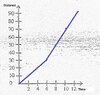
View attachment 6051

View attachment 6050

Where do I need help

Hoping my graph is correct

Show that the speed in the final 6 seconds is twice the speed in first 6 seconds

But I'm having trouble here , I know $ distance=\frac{distance}{time} $

Many Thanks :)
 

Attachments
  • okay 1.jpg
    okay 1.jpg
    26.6 KB · Views: 132
  • okay 2.jpg
    okay 2.jpg
    32.5 KB · Views: 134
  • Capturedistance.PNG
    Capturedistance.PNG
    1.4 KB · Views: 153
Mathematics news on Phys.org
The average speed $\overline{v}$ over some time interval $\Delta t$ is given by the change in distance $d$ divided by the change in time.

So for the first 6 seconds (assuming the initial position is at 0), we have:

$$\overline{v}_1=\frac{\Delta d}{\Delta t}=\frac{30-0}{6-0}$$

And for the last 6 seconds, we have:

$$\overline{v}_2=\frac{\Delta d}{\Delta t}=\frac{90-30}{12-6}$$

Can you now show that $\overline{v}_2=2\overline{v}_1$?
 
MarkFL said:
The average speed $\overline{v}$ over some time interval $\Delta t$ is given by the change in distance $d$ divided by the change in time.

So for the first 6 seconds (assuming the initial position is at 0), we have:

$$\overline{v}_1=\frac{\Delta d}{\Delta t}=\frac{30-0}{6-0}$$

And for the last 6 seconds, we have:

$$\overline{v}_2=\frac{\Delta d}{\Delta t}=\frac{90-30}{12-6}$$

Can you now show that $\overline{v}_2=2\overline{v}_1$?

Thank you very much :)

First 6 seconds

$$\overline{v}_1=\frac{\Delta d}{\Delta t}=\frac{30-0}{6-0}$$

$$\overline{v}_1=\frac{30-0}{6-0}=\frac{30}{6}$$=5 meters per second

Last 6 seconds

$$\overline{v}_2=\frac{90-30}{12-6}=\frac{60}{6}=$$10 meters per second

Yes Now it is shown that first 6 second speed=2*last 6 second speed

Have I plot the distance time graph correctly? :)

Many Thanks :)
 
Yes, your plots look good to me. (Star)

Using our new TikZ feature:

\begin{tikzpicture}
%preamble \usepackage{pgfplots}
\begin{axis}
\addplot coordinates {(0,0) (2,10) (4,20) (6,30) (8,50) (10,70) (12,90)};
\end{axis}
\end{tikzpicture}
 
MarkFL said:
Yes, your plots look good to me. (Star)

Using our new TikZ feature:

\begin{tikzpicture}
%preamble \usepackage{pgfplots}
\begin{axis}
\addplot coordinates {(0,0) (2,10) (4,20) (6,30) (8,50) (10,70) (12,90)};
\end{axis}
\end{tikzpicture}

Thank you very much MarkFL ! (Happy) (Smile) (Party) , And that's when TIKz comes handy! :)