How to transform a plot to use a logarithmic scale?

9 replies · 5K views · last reply
Leonid92
Messages
45
Reaction score
2
I wrote the following code in MATLAB:
Code:
t = [0:0.001:0.1];
noise = randn(1,size(t,2));
a = 15*10^9;
b = 15*10^(-3);
c = 7*10^8;
y = a*exp(-t/b)+c+noise*100000000;
fun = @(p,t)p(1)*exp(-t/p(2))+p(3);
p0 = [15.5*10^9, 14*10^(-3), 6*10^8];
p = lsqcurvefit(fun, p0, t, y);
t_fit = [0:0.0001:0.1];
y_fit = fun(p,t_fit);
fig = figure('Visible','on');
plot(t,y,'.');
hold on;
grid on;
plot(t_fit,y_fit,'r','linewidth',2);
disp(sprintf('a=%d; b=%.4f; c=%d',p(1),p(2),p(3)))
Thus I generated data whose behavior is described by equation y = a*exp(-t/b)+c, with adding some noise. Then I fit mentioned function to these data and found values of parameters:
Code:
a=1.550000e+10; b=0.0149; c=6.000000e+08
The plot of simulated data and fit is below:
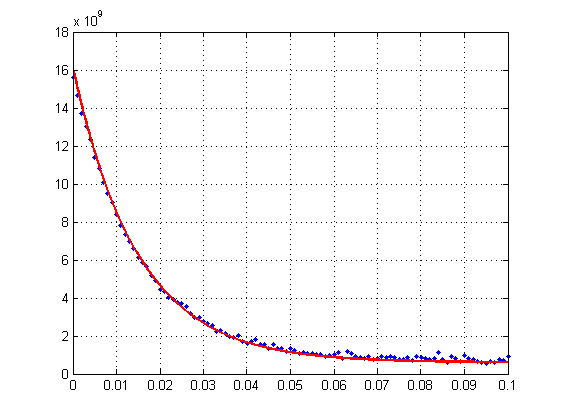
MATLAB plot of noisy blue data points decaying from about 16 x 10^9 at t=0 to near 0.7 x 10^9 by t=0.1, with a smooth red fitted exponential-plus-offset curve through them.

One person told me that it would be good to consider this problem in logarithmic scale. Could you please tell me, what is usually implied when talking about transforming ordinary plot to logarithmic scale? How should I implement this procedure? Should I first convert my simulated y-values into log-scale and after that perform fit with another function? What formulas should I use? Is it reasonable to use logarithm with base 10 or logarithm with base 'e'?
I will be very appreciate for any help or advice.
P.S. Unfortunately, I don't have opportunity to ask that person in more detail regarding this question.
 
Attachments
  • MATLAB plot of noisy blue data points decaying from about 16 x 10^9 at t=0 to near 0.7 x 10^9 by t=0.1, with a smooth red fitted exponential-plus-offset curve through them.
    plot-exp.png
    2.7 KB · Views: 1,871
Dr Transport said:
solve for [itex]t[/itex], it took me two lines, it is easily found.
You mean
Code:
b*ln( (y-c)/a ) = -t
?
I don't understand. I have simulated data and need to convert y-values to log-scale. Should I just take logarithm(y) ?
 
jedishrfu said:
Have you tried substituting log(y_fun) for y_fun in the plot() line?

In my code, I changed two lines:
Code:
plot(t,log(y),'.');
plot(t_fit,log(y_fit),'r','linewidth',2);
And the plot is:
Scatter plot of noisy blue data points with a smooth red fitted curve, decreasing from about 23.5 at x = 0 to about 20.25 at x = 0.1, with grid lines.

But I have doubt, is it right? I mean, is this what I need? What is the sense in this operation? I thought that firstly I should convert simulated y-values to log-scale, and then perform fitting with new, logarithmic function - fit logarithmic function to transformed y-values, is it right?
 
Attachments
  • Scatter plot of noisy blue data points with a smooth red fitted curve, decreasing from about 23.5 at x = 0 to about 20.25 at x = 0.1, with grid lines.
    plot-exp1.png
    3 KB · Views: 1,230
I tried the following:
Code:
t = [0:0.001:0.1];
noise = randn(1,size(t,2));
a = 15*10^9;
b = 15*10^(-3);
c = 7*10^8;
y = a*exp(-t/b)+c+noise*100000000;
y = log(y); % here is the change!
fun = @(p,t)log(p(1)*exp(-t/p(2))+p(3)); % here is the change!
p0 = [15.5*10^9, 14*10^(-3), 6*10^8];
p = lsqcurvefit(fun, p0, t, y);
t_fit = [0:0.0001:0.1];
y_fit = fun(p,t_fit);
fig = figure('Visible','on');
plot(t,y,'.');
hold on;
grid on;
plot(t_fit,y_fit,'r','linewidth',2);
disp(sprintf('a=%d; b=%.4f; c=%d',p(1),p(2),p(3)))

The plot is:
Scatter plot of noisy blue points with a red fitted curve; the curve decays from about 23.5 at x=0 to about 20.25 at x=0.1, with the points flattening out near 20.5 at larger x.

I.e. firstly I converted simulated y-values to ln(y), and then performed fitting with function log( a*exp(-t/b)+c ), and it is seen that fit is not good.
Found parameters in this case are the following:
Code:
a=1.550000e+10; b=0.0156; c=6.000001e+08
So for me, transition to log-scale doesn't make sense.
 
Attachments
  • Scatter plot of noisy blue points with a red fitted curve; the curve decays from about 23.5 at x=0 to about 20.25 at x=0.1, with the points flattening out near 20.5 at larger x.
    plot-exp2.png
    3 KB · Views: 1,131
Problem being the constant present, and the weights of the individual points. In the normal fit the points values had equal weights. In the fit of the log the low values get disproportional weights.
 
  • Like
Likes   Reactions: Leonid92