Homework Help Overview
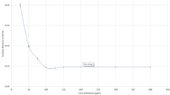
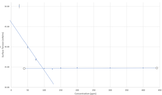
The discussion revolves around estimating uncertainties from a graph related to measurements of surface tension at various concentrations (ppm). The original poster seeks to determine the uncertainty for a concentration point (175 ppm) that was not directly measured, while participants explore the implications of this request.
Discussion Character
- Exploratory, Assumption checking, Conceptual clarification
Approaches and Questions Raised
- Participants discuss the lack of sufficient information to conclude uncertainties and question how error bars were assigned. There are inquiries about the nature of the graph, the fitted curve, and the significance of observed dips in the data. Some suggest estimating uncertainties based on nearby measured points, while others express concerns about the validity of interpolating values without a theoretical model.
Discussion Status
The conversation is ongoing, with various perspectives being explored. Some participants have provided insights into the nature of the measurements and the potential for estimating uncertainties, while others emphasize the need for careful consideration of the data's context and limitations.
Contextual Notes
Participants note that the original measurements were taken with a specific instrument, and the errors were calculated based on standard deviation from multiple measurements. There is also mention of the potential influence of measurement sequence and the need for fresh solutions for each data point.