shirozack
- 37
- 3
- Homework Statement
- a 600 ohm fixed resistor Rf is connected in series with a variable resistor Rv that goes from 0-800ohms. the battery is 6V.
when Rv is 0ohm, the voltage Vf across the Rf is 6V. Vv is 0V.
when Rv is 800 ohm, Vf is 2.6V and Vv is 3.4V
Plot the v-r graph of both Vf and Vv (from 0 to 6V) against Rv (from 0-800 ohms)
- Relevant Equations
- na
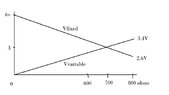
I have plotted the V-R graph.
when Rv is 600 ohms, Rf is also 600ohms, which means the voltage across both resistors should be split evenly at 3V each since batt is 6V.
however, from the graph, i noticed that Vf is 3.4V and Vv is 2.6V instead at 600 ohms.
i would like to know where did it go wrong? are the graphs not supposed to be a straight line?
why is the intersection at 700 ohms instead which is 3V.
thanks
when Rv is 600 ohms, Rf is also 600ohms, which means the voltage across both resistors should be split evenly at 3V each since batt is 6V.
however, from the graph, i noticed that Vf is 3.4V and Vv is 2.6V instead at 600 ohms.
i would like to know where did it go wrong? are the graphs not supposed to be a straight line?
why is the intersection at 700 ohms instead which is 3V.
thanks
Attachments