MHB Is My Application of the Neyman-Pearson Lemma Correct?

  • Thread starter Thread starter mathjam0990
  • Start date Start date
  • Tags Tags
    Apply
AI Thread Summary
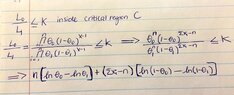
The discussion focuses on the application of the Neyman-Pearson Lemma in hypothesis testing, specifically for a single observation. The critical region is defined by the likelihood ratio of two hypotheses, leading to the inequality involving the likelihoods of the parameters. The calculation shows that the rejection region for the null hypothesis is determined by a threshold \( k^* \), which can be computed from the type I error rate. The conversation also suggests that the approach can be extended to multiple observations, although this may complicate the analysis. Overall, the application of the Neyman-Pearson Lemma is confirmed to be on the right track, with further calculations needed for \( k^* \).
mathjam0990
Messages
28
Reaction score
0
View attachment 5426What I have done so far...

View attachment 5427

Is this correct so far? If not, would someone be able to provide an explanation as to how to solve this? I am not sure if I am going in the right direction. Thank you
 

Attachments

  • (4).jpg
    (4).jpg
    34.6 KB · Views: 136
  • (5).jpg
    (5).jpg
    26.1 KB · Views: 114
Physics news on Phys.org
Your work is fine so far! However, the question states that we only consider a single observation. Therefore, you just have to consider the quotient of the likelihoods for one observation $x$: The critical region $C$ is given by
$$\frac{L(\theta_0 \ | \ x)}{L(\theta_1 \ | \ x)} \geq k.$$
An easy calculation gives
$$\frac{L(\theta_0 \ | \ x)}{L(\theta_1 \ | \ x)} = \frac{\theta_0 (1-\theta_0)^{x-1}}{\theta_1 (1-\theta_1)^{x-1}} = \left(\frac{\theta_0}{\theta_1}\right)\left(\frac{1-\theta_0}{1-\theta_1}\right)^{x-1} \geq k,$$
which implies that (please recheck this)
$$x \geq 1 + \frac{\ln\left(\frac{k \theta_1}{\theta_0}\right)}{\ln\left(\frac{1-\theta_0}{1-\theta_1}\right)} := k^{*}.$$
Hence, by the Neyman-Pearson lemma, the rejection region for the most powerful hypothesis test $H_0: \theta = \theta_0$ and $H_A: \theta =\theta_1$ where $\theta_1>\theta_0$ is given by $x \geq k^{*}$. Note that since the geometric distribution is discrete, this critical region $C = \{k^{*},k^{*}+1,\ldots,\}$. We still need to compute $k^{*}$. This can be done by looking at the type $I$-error, since $\mathbb{P}(H_0 \ \mbox{is false} \ | \ H_0) = \alpha$. Now $H_0$ is false if $x \geq k^{*}$ and hence the type $I$-error satisfies
\begin{align}
\mathbb{P}(X \geq k^{*} \ | \theta = \theta_0) = \sum_{k = k^{*}}^{\infty} (1-\theta_0)^{k-1} \theta_0 = \alpha,
\end{align}
from which you can extract $k^{*}$. I think you can also generalize this to multiple observations $x_1,\ldots,x_n$. In that case you will have to determine the distribution of $\overline{x}$ which can be a little bit more messy.
 
Back
Top