Zaprime
- 1
- 0
Hi.
I hope someone can assist me?
I have a sensor that is being used to detect a pulse triggered from a point on the surface of a disk rotating past the sensor. I am processing the data in real time to determine if the values would count as a pulse so that I can count up the number of revolutions.
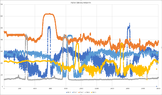
Here is a picture of some sample data. The width of the pulse can vary quite significantly, as can the offset.
View attachment 8250
My current methodology is to take a cumulative average over time. I then calculate the percentage of the sensor value relative the average to normalise the data. I look at the normalised data and check for a high state and a low state. I also look at the period that elapses between declaring a high and low state to see if this is actually a realistic pulse.
I'm sampling every 5 ms. The problem I have with this method is that it requires a lot of adjusting and isn't proving very reliable across a bigger sample size. I'm wondering if there is a better way to track a pulse in real time?
I can post a CSV file with the values if someone would like to have a more detailed look at the data. There are some gaps in the data which I'm busy trying to track down and fix.
I hope someone can assist me?
I have a sensor that is being used to detect a pulse triggered from a point on the surface of a disk rotating past the sensor. I am processing the data in real time to determine if the values would count as a pulse so that I can count up the number of revolutions.
Here is a picture of some sample data. The width of the pulse can vary quite significantly, as can the offset.
View attachment 8250
My current methodology is to take a cumulative average over time. I then calculate the percentage of the sensor value relative the average to normalise the data. I look at the normalised data and check for a high state and a low state. I also look at the period that elapses between declaring a high and low state to see if this is actually a realistic pulse.
I'm sampling every 5 ms. The problem I have with this method is that it requires a lot of adjusting and isn't proving very reliable across a bigger sample size. I'm wondering if there is a better way to track a pulse in real time?
I can post a CSV file with the values if someone would like to have a more detailed look at the data. There are some gaps in the data which I'm busy trying to track down and fix.
Attachments