DrWahoo
- 45
- 0
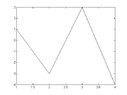
The MATLAB command plot plots points in a two-dimensional figure and connects
them with straight line segments. So, here $y$ is a vector with $n$ entries
$(1; y(1)); (2; y(2)); (3; y(3)); : : : ; (n; y(n)):$
So the MATLAB command is given below for an example:
Yields the output here:
View attachment 7555
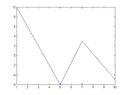
We can also define them in function form where each $x$ value corresponds to an output- $y$ value.
Code is given below;
Matlab output is below;
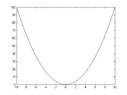
View attachment 7556Now let's try a simple function; let's graph $f(x)=x^2$
We first try using the following code;
Then we get the following output. Does this look strange?
View attachment 7557
This graph doesn't show me anything about the function for positive $x$ values? Can we fix this?
Yes, recall MATLAB is primarily based off matrices hence the "mat" lab. Aka Matrix labratories.
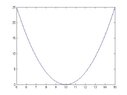
So let's define the values of the domain we want to see
Say for instance we want to look at the graph of the function on the interval $[-10, 10]$
We would use the following code
To get the desired output below;
View attachment 7560So what if we want to graph a simple quadratic equation that is shifted to the left 10 points?
So let's start with the function $f(x)= x^2$ , shifting it to the right 10 units, we have $f(x)=(x-10)^2$
Now let's try to graph this. We could use points, but let's see if we can get the full graph. Hence, we shall try the following code knowing the x coordinate of the vertex is at 10, so we use the interval $[5,15]$
The desired output is given below;
View attachment 7561This will continue into differential equations, phase plots, and gradient fields. Will update shortly.
them with straight line segments. So, here $y$ is a vector with $n$ entries
$(1; y(1)); (2; y(2)); (3; y(3)); : : : ; (n; y(n)):$
So the MATLAB command is given below for an example:
Code:
y = [1 -3 3 -4];
>> plot(y)
Yields the output here:
View attachment 7555
We can also define them in function form where each $x$ value corresponds to an output- $y$ value.
Code is given below;
Code:
y = [10 2 -6 3 -5]; x=[1 3 5 7 10];
>> plot(x,y)View attachment 7556Now let's try a simple function; let's graph $f(x)=x^2$
We first try using the following code;
Code:
y=x.^2;
plot(x,y);View attachment 7557
This graph doesn't show me anything about the function for positive $x$ values? Can we fix this?
Yes, recall MATLAB is primarily based off matrices hence the "mat" lab. Aka Matrix labratories.
So let's define the values of the domain we want to see
Say for instance we want to look at the graph of the function on the interval $[-10, 10]$
We would use the following code
Code:
x=-10:0.1:10;
y=x.^2
plot(x,y)View attachment 7560So what if we want to graph a simple quadratic equation that is shifted to the left 10 points?
So let's start with the function $f(x)= x^2$ , shifting it to the right 10 units, we have $f(x)=(x-10)^2$
Now let's try to graph this. We could use points, but let's see if we can get the full graph. Hence, we shall try the following code knowing the x coordinate of the vertex is at 10, so we use the interval $[5,15]$
Code:
x=5:0.1:15;
y=(x-10).^2
plot(x,y)
The desired output is given below;
View attachment 7561This will continue into differential equations, phase plots, and gradient fields. Will update shortly.