Matlab - calculate phase shift using fft

16 replies · 15K views · last reply
daymos
Messages
8
Reaction score
0
hello,

I have 3 signals in the form of sampled values. When I plot them using

plot (t,vPa,t,vPb,t,vPc)

where vPa, vPb, vPc contains the values and t contains the sampling istants I get this:
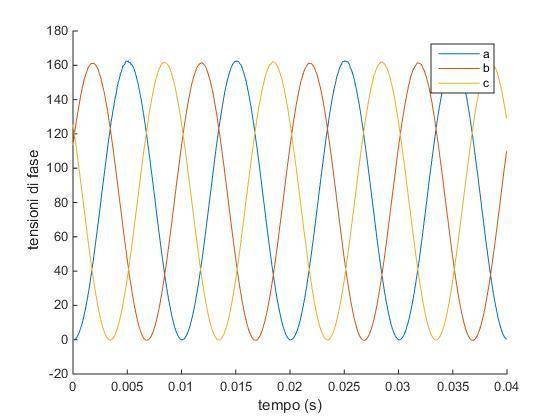
Line plot of three phase voltages a, b and c in volts against time in seconds from 0 to 0.04 s; three sinusoids of equal amplitude, about 160, are offset in phase from one another.
when I calculate phase shift using fft I get phase angle = 0.
I have tried using my own code ( which works normally on other vectors) and also a function downloaded from Mathworks and the result is always zero.

The mathworks function is at the end.

what am I doing wrong?

Thanks
Mattia
Matlab:
%%%%%%%%%%%%%%%%%%%%%%%%%%%%%%%%%%%%%%%%%%%%%%%%%%%%%%%%
%              Phase Difference Measurement            %
%               with MATLAB Implementation             %
%                                                      %
% Author: M.Sc. Eng. Hristo Zhivomirov        12/01/14 %
%%%%%%%%%%%%%%%%%%%%%%%%%%%%%%%%%%%%%%%%%%%%%%%%%%%%%%%%function PhDiff = phdiffmeasure(x, y)

% function: PhDiff = phdiffmeasure(x, y)
% x - first signal in the time domain
% y - second signal in the time domain
% PhDiff - phase difference Y -> X, degrees

% represent x as column-vector if it is not
if size(x, 2) > 1
    x = x';
end

% represent y as column-vector if it is not
if size(y, 2) > 1
    y = y';
end

% signals length
xlen = length(x);
ylen = length(y);

% window preparation
xwin = hanning(xlen, 'periodic');
ywin = hanning(ylen, 'periodic');

% fft of the first signal
X = fft(x.*xwin);

% fft of the second signal
Y = fft(y.*ywin);

% phase difference calculation
[~, indx] = max(abs(X));
[~, indy] = max(abs(Y));
PhDiff = angle(Y(indy)) - angle(X(indx));
PhDiff = PhDiff*180/pi;

end
 
I don't see what you did wrong.

However, have you looked at the intermediate values for X and Y and the angle(X(indx)) values that are used to compute the phase difference?
 
I have now, angle(Y(indy)) and angle(X(indx)) are both zero.

I have attached the original 3 vectors.
 
Attachments
Last edited:
I have found a different way to calculate phase shift that can be used in this case:

h1 = hilbert(vPa);

h2 = hilbert(vPb);

phase_rad = max(angle(h1 ./ h2))

which gives back the correct value of 2/3 * pi.

However I would be couriois to know why for this specific case fft didnt work. I thought it was a pretty generic method
 
I meant the X and Y in the function you showed.

Aren't they supposed to be mostly zeros with a few spikes?

I think you need to look at each line of the function to decide if its doing the right thing.

The code looks like it applies an FFT to the two input signals to produce a frequency spectrum. From that it determines the highest spike and from that subtracts them to determine the phase difference.
 
yes that is what it does. Also my own code did that. ffts are mostly zero with one big spike on 50 Hz.
I am positive both my own code and the one I posted are correct. becaouse I have used them many times and they returned correct results
 
Then I guess there's something unique about your input data and the function you listed. Perhaps if you step through the function interactively you'll be able to spot the difference. It could be a number of elements limit or datatype mismatch...
 
Perhaps your data doesn't have an FFT with a significant frequency that can be picked out i.e. no one max value

Try plotting the FFT's of both signals to see what you get.
 
  • Like
Likes   Reactions: daymos
thanks for the spectrum plot tips jedishrfu
I haven't solved it yes but I think you pointed me in the right direction.

this is the spectrum of the 3 signals:

Three stacked MATLAB magnitude spectrum plots with Hz on the horizontal axis from 0 to 150; each shows a large spike near 0 Hz (about 8 x 10^4) and a smaller spike at 100 Hz (about 4 x 10^4), with near-zero points at 25, 50, 75, 125 and 150 Hz.
So there is a huge spike at zero Hz.

I have composed each signal multiplying 2 previous signals that where at 50Hz. So I expect the new signals to be at 100 Hz. And I see a spike there.
But I don't understand why the spike in zero.
 
Last edited:
You have a DC component in you signal. max function should detected the peak of the periodic signal ?
 
soarce said:
You have a DC component in you signal. max function should detected the peak of the periodic signal ?
when I use max function it gives back the index of frequency = 0 HZ
 
Then the answer is correct, the DC components have zero phase shift :)
 
MATLAB stem plots of FFT magnitude against frequency in Hz, three stacked panels, each with a single tall peak at 100 Hz and near-zero values at other frequencies from 0 to 150 Hz.
soarce said:
Then the answer is correct, the DC components have zero phase shift :)

well, ok that's correct.

Since I need the 100Hz I subtracted the mean value of the signal to itself.
thanks a lot!
 
The zero value of the Fourier transform will always just be the mean give a or take a factor of pi and volume.
 
In general, it's usually a good idea to make sure the signal you wish to pass through your FFT has zero mean, that way you are only dealing with nonzero frequency components.
 
the original 2 signals had no DC component. But by multiplying them value by value the resulting signal was no longer centered on the zero for the vertical axis.
Pretty obvious after you get it..
 
what did you change ad your coding to make that output? thanks in advance :)