Govind
- 11
- 1
- TL;DR
- Could someone post a single graph ( adding some more details in first graph about accuracy precision and Trueness) of probability distribution in which all the parameters of measurement like Random error, Systematic error, Total error, Uncertainity, Accuracy, Precision and Trueness are described? It would also be fine if you upload a photo a hand-drawn graph in copy rather than a printed one.
I am new to statistics and recently learned about ISO guidelines for Accuracy & Precision and Uncertainty & Error. But there are some graphs of probability distribution I found on internet which I am not able to grasp.
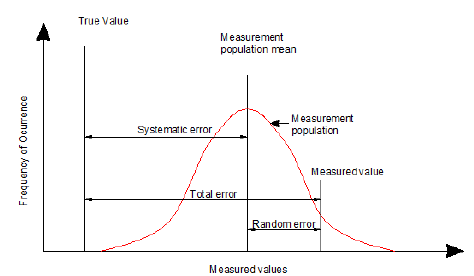
image Source
Q. In this graph(above) if systematic error is zero then average value will be the true value! How's that possible? i.e. if we take measurements under a condition of zero systematic error , average of whatever we measured will be equal to true value but aren't there some random error in average of measurement? And why random error here is described with respect to measured value not to mean of measured value?
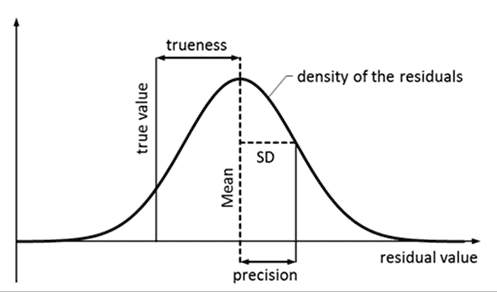
Image Source
In first graph total and random errors are described wrt measured value not to mean of measurements and here in 2nd graph accuracy and precision are related to mean of measurement, no concept of measured value.
Could someone post a single graph ( adding some more details in first graph about accuracy precision and Trueness) of probability distribution in which all the parameters of measurement like Random error, Systematic error, Total error, Uncertainity, Accuracy, Precision and Trueness are described? It would also be fine if you upload a photo a hand-drawn graph in copy rather than a printed one.
image Source
Q. In this graph(above) if systematic error is zero then average value will be the true value! How's that possible? i.e. if we take measurements under a condition of zero systematic error , average of whatever we measured will be equal to true value but aren't there some random error in average of measurement? And why random error here is described with respect to measured value not to mean of measured value?
Image Source
In first graph total and random errors are described wrt measured value not to mean of measurements and here in 2nd graph accuracy and precision are related to mean of measurement, no concept of measured value.
Could someone post a single graph ( adding some more details in first graph about accuracy precision and Trueness) of probability distribution in which all the parameters of measurement like Random error, Systematic error, Total error, Uncertainity, Accuracy, Precision and Trueness are described? It would also be fine if you upload a photo a hand-drawn graph in copy rather than a printed one.