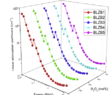
Need a 3d scatter plot with connected lines
Click For Summary
SUMMARY
The discussion focuses on creating a 3D scatter plot with connected lines using programming languages such as Python, R, or Octave. Users seek source files and examples to implement this visualization effectively. Python's Matplotlib, R's ggplot2, and Octave's plotting capabilities are highlighted as suitable tools for achieving this task.
PREREQUISITES- Familiarity with Python's Matplotlib library
- Understanding of R's ggplot2 package
- Basic knowledge of Octave for 3D plotting
- Concept of scatter plots and data visualization techniques
- Explore Python's Matplotlib 3D plotting capabilities
- Learn how to create 3D visualizations using R's plotly package
- Investigate Octave's plotting functions for 3D data representation
- Study best practices for connecting points in scatter plots
Data scientists, statisticians, and anyone involved in data visualization who needs to create 3D scatter plots with connected lines.
Similar threads
- · Replies 8 ·
- · Replies 4 ·
- · Replies 24 ·
- · Replies 1 ·
- · Replies 1 ·
- · Replies 2 ·
- · Replies 2 ·
- · Replies 3 ·
Wood/Glass/Metal
Which 3D printer would be best for this printing job?
- · Replies 8 ·
- · Replies 4 ·