Nuclear meltdown in 2015 on antineutrino map?

  • Context: Graduate 
  • Thread starter Thread starter TimeSkip
  • Start date Start date
  • Tags Tags
    2015 Map Nuclear
Join the discussion
Ask a follow-up here, or get your own question answered by working scientists, mathematicians and engineers — people, not an autocomplete.
Real named experts · corrections over time · the nuance an AI answer skips
7 replies · 1K views
TimeSkip
Messages
44
Reaction score
4
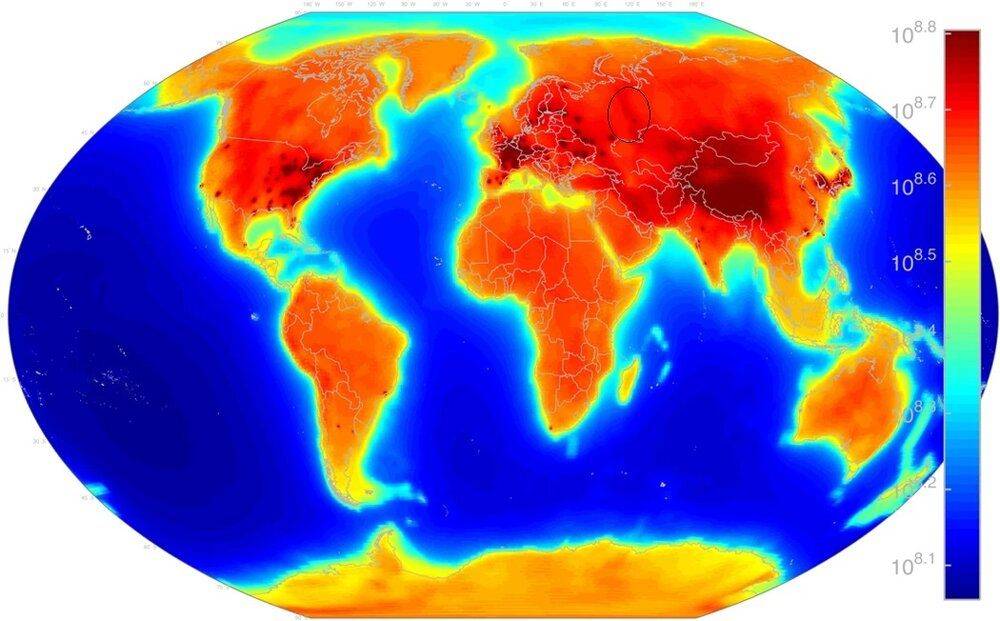
I was browsing a antineutrino map and was wondering if there was a meltdown in 2015 when it was taken.

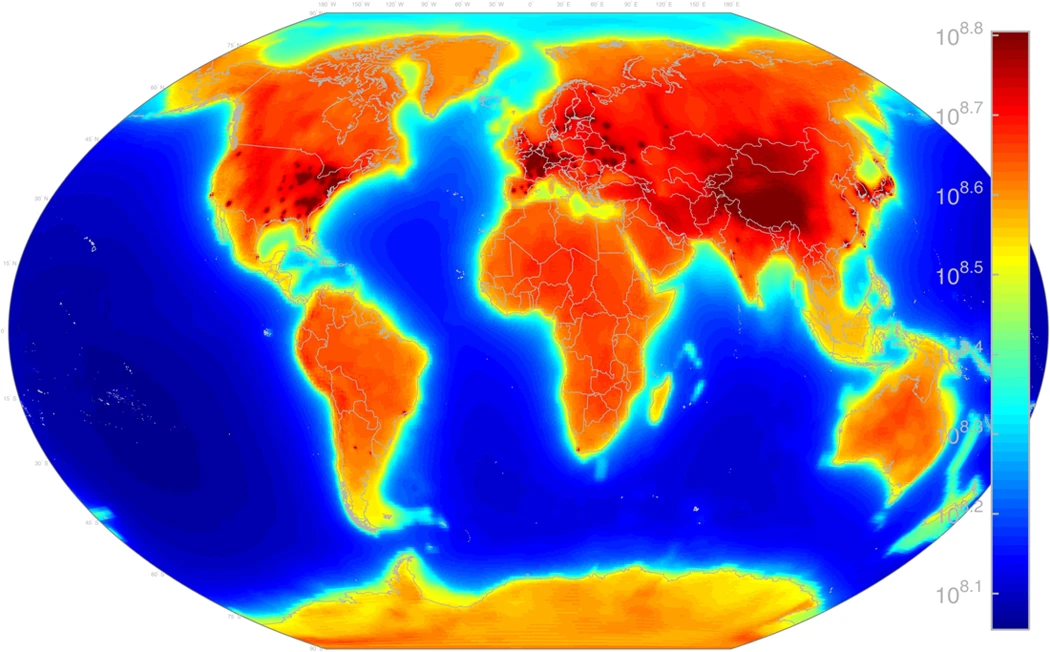
I never heard about it in the news; but, here are some pictures from the paper:

https://www.nature.com/articles/srep13945
41598_2015_Article_BFsrep13945_Fig1_HTML.jpg

41598_2015_Article_BFsrep13945_Fig1_HTML.jpg


Thoughts?
 
Physics news on Phys.org
TimeSkip said:
I was browsing a antineutrino map and was wondering if there was a meltdown in 2015 when it was taken.

I never heard about it in the news; but, here are some pictures from the paper:

Thoughts?
What are you talking about? What leads you to believe there is a meltdown shown somewhere in those graphics?
 
  • Like
Likes   Reactions: Vanadium 50, Keith_McClary, Klystron and 1 other person
russ_watters said:
What are you talking about? What leads you to believe there is a meltdown shown somewhere in those graphics?
The article mainly refers to 'geoneutrino' emanations from the Earth including mixing models of the three known antineutrinos.

The colors selected for the maps: blue to yellow to red resemble temperature readings. The bright red color associated with antineutrino detection might mislead a cursory reader that something is melting due to high temperatures?

Fix: change map colors to complements. Red becomes green, blue to orange, yellow to violet. Incipient 'meltdowns' will instead resemble foliage. :smile:
 
Last edited:
The color doesn't look uniform around that circled spot.

Was just wondering.

As in: Something like wind blew something to the north of the reactor in question.
 
TimeSkip said:
The color doesn't look uniform around that circled spot.

Was just wondering.

As in: Something like wind blew something to the north of the reactor in question.
The dark splotches in the US, Europe, Asia (Japan, S. Korea, Taiwan, eastern China), S. Americal and S. Africa are operating nuclear power plants. One has to look at the energy levels of the neutrinos, since there is a mix of U, Th isotopes and their decay products, and fission products and their decay products. Note that beta decay involves the release of an electron (beta particle) and anti-neutrino.

The red circle encompasses the Ural mountains. In areas like that, it is mostly deposits of U and Th.
Edit/update: The darkest splotch (spot) in the red oval, toward the SE of center, is Mayak, where U and Pu are processed, and fission products (nuclear waste) are accumulated. There have been numerous criticality and other accidents at the site, but in the worst case, a plume spread to the northeast, or about 45 degrees from the darker area (Ural Mountains).
https://en.wikipedia.org/wiki/Mayak#List_of_accidents
https://en.wikipedia.org/wiki/Kyshtym_disaster
https://en.wikipedia.org/wiki/Kysht...e:Map_of_the_East_Urals_Radioactive_Trace.png

Please read the article.
 
Last edited:
  • Like
  • Informative
Likes   Reactions: russ_watters, Klystron, Vanadium 50 and 1 other person
Can someone enlighten me as to what happened in the Great Lakes in the US? Why so much antineutrino emission?
 
Will you please read the article?

Your original question about what was going on in the circle you drew was answered on Page 5. This question is answered on page 3, and you can get more details by clicking on the link on page 9.
 
  • Like
Likes   Reactions: Astronuc