- 1,262
- 755
- TL;DR
- Plotting a compton scattering Dataset
I recently thought it might be interesting to see if there were any online simulations or videos of Compton Scattering experiments. The search result yielded following:
Given the standard equation: $$1-\cos\theta_d=\frac{E_0 \Delta E}{E_1 E_2} ,$$ we should get a straight line with gradient ##\frac {E_0}{E_1}## if we plot ##1-\cos\theta_d## on the x-axis against ##\frac{\Delta E}{E_2}## on the the y-axis. ##E_2## is the energy (at various angles) of the scattered photon(s) and ##\Delta E## is the change in energy referenced against that recorded at ##0^\circ##. So here is my data set and plot based on the above video. Well we do get a clearly linear relationship but my concern is that the regression obtained linear gradient is nowhere near ##\frac {E_0}{E_1}## where ##E_0## is electron rest energy.
Any ideas on what the problem is ? Have to say I thought we needed much higher energy photons than 17.48 keV as in this video experiment (?).
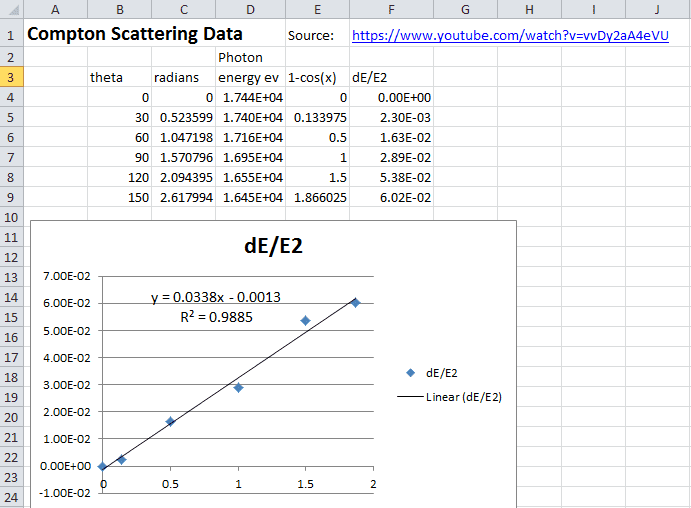
Given the standard equation: $$1-\cos\theta_d=\frac{E_0 \Delta E}{E_1 E_2} ,$$ we should get a straight line with gradient ##\frac {E_0}{E_1}## if we plot ##1-\cos\theta_d## on the x-axis against ##\frac{\Delta E}{E_2}## on the the y-axis. ##E_2## is the energy (at various angles) of the scattered photon(s) and ##\Delta E## is the change in energy referenced against that recorded at ##0^\circ##. So here is my data set and plot based on the above video. Well we do get a clearly linear relationship but my concern is that the regression obtained linear gradient is nowhere near ##\frac {E_0}{E_1}## where ##E_0## is electron rest energy.
Any ideas on what the problem is ? Have to say I thought we needed much higher energy photons than 17.48 keV as in this video experiment (?).