Discussion Overview
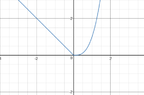
The discussion revolves around methods for graphing a piecewise-defined function by hand, specifically the function defined as \( y = |x| \) for \( x \leq 0 \) and \( y = x^3 \) for \( x > 0 \). Participants explore the process of plotting each segment of the function on the same coordinate plane.
Discussion Character
- Exploratory
- Technical explanation
- Conceptual clarification
Main Points Raised
- One participant asks about the easiest way to graph the piecewise-defined function by hand, presenting the function in both descriptive and mathematical forms.
- Another participant provides a detailed breakdown of the function, simplifying it and explaining how to plot each piece separately on the graph.
- A question is raised about whether the pieces are graphed one at a time on the same xy-plane, which is confirmed by another participant.
- One participant mentions using Wolfram for graphing, indicating a preference for computational tools over manual graphing.
Areas of Agreement / Disagreement
Participants generally agree on the method of graphing each piece of the function on the same xy-plane, though there is no consensus on the preference for manual versus computational graphing methods.
Contextual Notes
There are no explicit limitations or unresolved mathematical steps mentioned in the discussion.
Who May Find This Useful
This discussion may be useful for students learning about piecewise-defined functions, educators seeking to understand different teaching approaches, and individuals interested in graphing techniques.