Plotting y=x^1/3 - Why Different Results?

  • Context:
  • Thread starter Thread starter Yankel
  • Start date Start date
  • Tags Tags
    Plotting
Join the discussion
Ask a follow-up here, or get your own question answered by working scientists, mathematicians and engineers — people, not an autocomplete.
Real named experts · corrections over time · the nuance an AI answer skips
2 replies · 2K views
Yankel
Messages
390
Reaction score
0
Dear all,

I was using the computer in order to plot the graph of

\[y=x^{\frac{1}{3}}=\sqrt[3]{x}\]

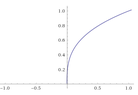
and two different plotters gave two different results. I don't understand why. Can you kindly explain ?

The results are:

View attachment 8447

View attachment 8448

Thank you !
 

Attachments
  • plot 1.PNG
    plot 1.PNG
    1.4 KB · Views: 141
  • plot 2.PNG
    plot 2.PNG
    2.3 KB · Views: 160
Mathematics news on Phys.org
First, of course, those are the same for x> 0 just scaled differently. As for x< 0 it looks like the first plotter is using logarithms "unthinkingly" to calculate fractional powers and the logarithm of negative numbers do not exist.
 
Generally $x^{1/3}$ is considered to be undefined for negative $x$, although some books do effectively define it as $-(-x)^{1/3}$.

Reasons are:
  1. The power identity $a^{b\cdot c}=(a^b)^c$ breaks down. Consider:
    $$-1 = (-1)^{2/3\cdot 3/2} \ne ((-1)^{2/3})^{3/2} = 1^{3/2} = 1$$
  2. Calculators evaluate it as $x^{0.33333}$, which is undefined for negative x.
    Note that we can only define something like $x^{1/3}$ for negative x if the power is a fraction with an odd number in the denominator, but that is generally not supported by calculators.