Buzz Bloom
Gold Member
- 2,517
- 465
My wife keeps telling me that I need to avoid sitting at the computer so much. She sent me the following link.
I confess that I don't find the data presented in the article very convincing, and I would appreciate comments regarding the statistical analysis from knowledgeable participants.
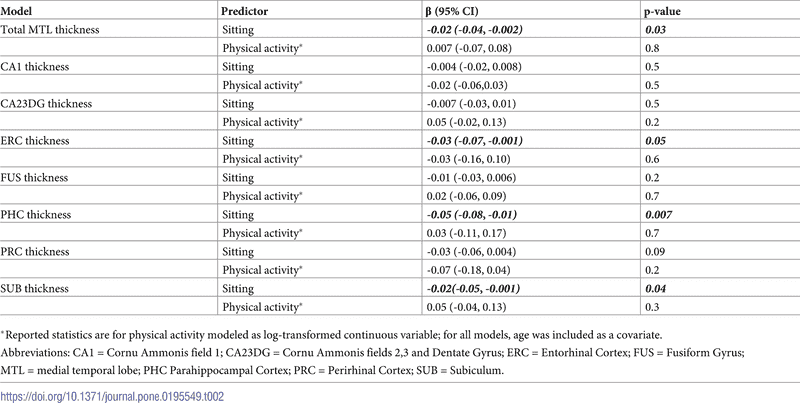
As I see it, the data consists of two scatter diagrams (Figs. 1 and 2) and two data summaries (Tables 1 and 2). Table 1 describes the characteristics of the population, and Table 2 (shown below) gives the statistical results. As I look at the scatter diagrams, the steepness of the least mean square fit seems to me to be strongly influenced by a few data points I would call outliers. The data in Table 2 gives values for β and p-value. I do not understand what β represents, but the range of 95% CI seems seems odd that it is so much larger than the value of β.
I confess that I don't find the data presented in the article very convincing, and I would appreciate comments regarding the statistical analysis from knowledgeable participants.
As I see it, the data consists of two scatter diagrams (Figs. 1 and 2) and two data summaries (Tables 1 and 2). Table 1 describes the characteristics of the population, and Table 2 (shown below) gives the statistical results. As I look at the scatter diagrams, the steepness of the least mean square fit seems to me to be strongly influenced by a few data points I would call outliers. The data in Table 2 gives values for β and p-value. I do not understand what β represents, but the range of 95% CI seems seems odd that it is so much larger than the value of β.
