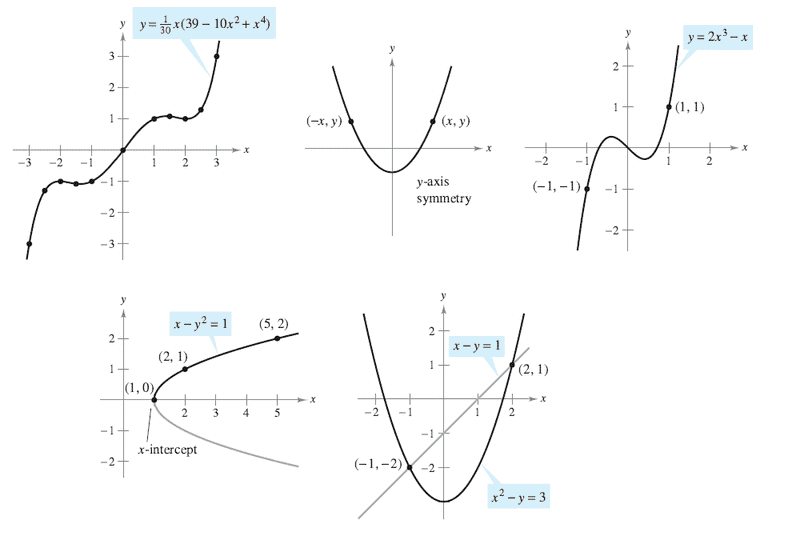
I would use a combination of plotting tool, e.g. gnuplot, and vector graphic tool, e.g. xfig, inkscape, corel draw. Then you export the image to any format you need.
LE: You can also use more sophisticated data plotting tools like OriginLab/IDL/PAW or alternatives.
Checkout FreeMat. Its a MATLAB clone that should be able to easily generate these graphs. Of course, you can use MATLAB too but it costs money whereas fremat is free.