jshayhsei
- 2
- 0
I'd like to know how to solve this. I'm pretty lost as to how to solve this. I want to say that the graph would look periodic because of the graph of the time would go down and then go back up again, but I really don't have anything concrete.
The question states:
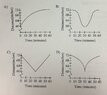
The circular clock has a diameter of 14 inches and its minute had has length 6 inches. It is placed on the wall so that the center of the clock is 66 inches above the ground. Which of the following graphs could represent the distance from the tip of the arrow of the minute hand to the ground with respect to time from 10 a.m. to 11 a.m.?
View attachment 8815
The question states:
The circular clock has a diameter of 14 inches and its minute had has length 6 inches. It is placed on the wall so that the center of the clock is 66 inches above the ground. Which of the following graphs could represent the distance from the tip of the arrow of the minute hand to the ground with respect to time from 10 a.m. to 11 a.m.?
View attachment 8815
Attachments