Tenenbaum & Pollard: why solution curve differs from differential equation at x=1

  • Level: Graduate 
  • Thread starter xorg
  • Start date
5 replies · 2K views · last reply
xorg
Messages
15
Reaction score
0
Hi. I'm reading the bookhttp://amzn.com/0486649407 ,
Cover of the Dover book Ordinary Differential Equations: An Elementary Textbook for Students of Mathematics, Engineering, and the Sciences, by Morris Tenenbaum and Harry Pollard, showing concentric ovals in blue, green and yellow with curves crossing them.

in self-study mode.
In page 53 and 54, below:
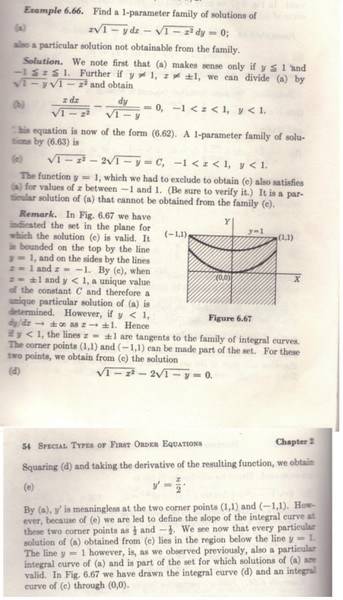
Printed textbook page with a worked example: differential equation solutions, and Figure 6.67 showing a shaded region bounded by y = 1, x = ±1 and the curve through points (1,1) and (-1,1).

Apparently does not make sense, because, If the differential equation is:
$$ \frac{\mathrm{d}y }{\mathrm{d} x} = x\frac{\sqrt{1-y}}{\sqrt{1-x^{2}}} $$

then dy/dx = ∞ when x = 1, and y < 0
however, in Image:
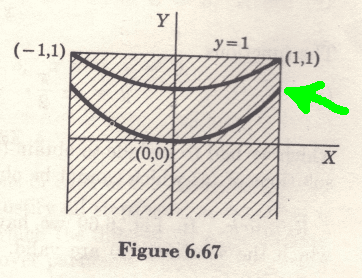
Figure 6.67: shaded region between y = 1 and two curves on axes X and Y, bounded by x from -1 to 1; the lower curve passes through (0,0) and the upper curve through the axis near 0.8; green arrow points at the right edge near (1,1).

dy / dx is not ∞ in point marked in green.

Then, in this point, the graph changes radically the slope? Apparent, does not make sense, It seems that the correct curve would go up until tangent to x = 1, while the particular solution says otherwise.

Why the differential equation "fails", and the solution of the differential equation not? I did not catch that.

I am studying alone, thank you for your patience.
 
Last edited by a moderator:
There is some gap in your knowledge about what it means for a graph to have a derivative. I would advice you read a calculus book and brush up on it. This idea is a very fundamental key point in ode.
 
To clarify the question: Why does the graph show a solution curve that is not asymptotic to the vertical line x = 1 ?

xorg said:
Apparently does not make sense, because, If the differential equation is:
$$ \frac{\mathrm{d}y }{\mathrm{d} x} = x\frac{\sqrt{1-y}}{\sqrt{1-x^{2}}} $$

then dy/dx = ∞ when x = 1, and y < 0

Did you mean "when [itex]y < 1[/itex] ?

however, in Image:
Figure 6.67: shaded region in the xy-plane bounded by the square from (-1,1) to (1,1) and the lower curve through (0,0), with a green arrow pointing to the right edge near (1,1) and the line y = 1 labelled at the top.

dy / dx is not ∞ in point marked in green.
 
Stephen Tashi said:
To clarify the question: Why does the graph show a solution curve that is not asymptotic to the vertical line x = 1 ?

Yes, if the dy/dx go to ∞ when x go to 1, then i guess in particular solution this should be the trend.
It is as if the particular solution and differential equation were conflicting.
Imagine that someone will draw the solution curves, from the dy / dx, at each point, does not match the presented solution.
However, the method of solution seems correct, that leaves me confused!

Did you mean "when [itex]y < 1[/itex] ?

YES, when y<1. Sorry.
 
xorg said:
Yes, if the dy/dx go to ∞ when x go to 1, then i guess in particular solution this should be the trend.
It is as if the particular solution and differential equation were conflicting.
Imagine that someone will draw the solution curves, from the dy / dx, at each point, does not match the presented solution.
However, the method of solution seems correct, that leaves me confused!
YES, when y<1. Sorry.

You are correct: the illustration is erroneous. The solution is correct, however. If you plot the family of solutions, you will get curves with vertical tangent lines x = 1 and x = -1 when y < 1, as described by the text.
In particular, if you isolate y in the family of solutions, you will get [itex]y = \frac{1}{4}x^2 + C\sqrt{1-x^2} + \frac{3}{4} - C^2[/itex], from which you can find the explicit derivative. You can see that it is only when C = 0 that the problematic derivative of the square root at x = 1, and at x = -1, disappears.
 
Attachments
  • Contour plot over x from -1 to 1 and y from 0 to 1: family of smooth, nested U-shaped curves that meet the top edge near x = ±1, shaded from dark purple at the bottom corners to pale grey-blue at the top.
    Contours.png
    12.3 KB · Views: 518
Last edited:
  • Like
Likes   Reactions: xorg
slider142 said:
You are correct: the illustration is erroneous. The solution is correct, however. If you plot the family of solutions, you will get curves with vertical tangent lines x = 1 and x = -1 when y < 1, as described by the text.
In particular, if you isolate y in the family of solutions, you will get [itex]y = \frac{1}{4}x^2 + C\sqrt{1-x^2} + \frac{3}{4} - C^2[/itex], from which you can find the explicit derivative. You can see that it is only when C = 0 that the problematic derivative of the square root at x = 1, and at x = -1, disappears.

Thank You!

The solution:
$$ \sqrt{1-x^{2}} - 2\sqrt{1-y} = C $$
Results:
$$ y = \frac{3}{4} + \frac{x^{2}}{4} + \frac{C\sqrt{1-x^{2}}}{2} - \frac{C^{2}}{4} $$
(in your solution, yourC = C/2)

Matlab Code
PHP:
x = linspace(-1,1,1000);
clf;
grid on;
hold on;
c=0;
y=3/4+(x.^2)/4 +(c/2)*sqrt(1-(x.^2))-(c/2)^2;plot(x, y, 'r');
c=-0.5;
y=3/4+(x.^2)/4 +(c/2)*sqrt(1-(x.^2))-(c/2)^2;plot(x, y, 'b');
c=-1;
y=3/4+(x.^2)/4 +(c/2)*sqrt(1-(x.^2))-(c/2)^2;plot(x, y, 'g');

Matlab Result
MATLAB plot of three curves over x from -1 to 1 with grid lines: red curve peaks at y of 0.75 near x = 0 and reaches 1 at both ends; blue curve dips to about 0.44 near x = 0; green curve dips to 0 near x = 0 and reaches about 0.75 at both ends.


c = 0

c = -0.5
c = -1


Thank you, Helped me a lot!