Discussion Overview
The discussion revolves around creating a TikZ diagram in LaTeX to represent certain inequalities on the complex plane, specifically focusing on shading areas defined by these inequalities. Participants explore how to implement this visually using TikZ commands.
Discussion Character
- Technical explanation
- Debate/contested
- Mathematical reasoning
Main Points Raised
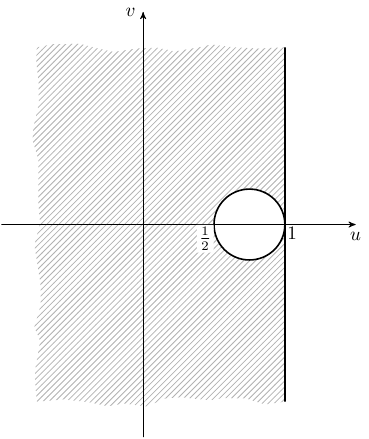
- One participant asks how to shade areas on the complex plane defined by the inequalities involving \(u\) and \(v\).
- Another participant suggests an alternative graphing approach involving different inequalities.
- Participants discuss specific TikZ commands and syntax, including the correct use of options in the \texttt{tikzpicture} environment.
- Errors related to TikZ commands are mentioned, with suggestions for correcting syntax and understanding error messages.
- There is a request for making certain elements of the diagram dashed, with a proposed solution involving TikZ options.
- One participant notes limitations due to lack of internet access, affecting their ability to troubleshoot effectively.
Areas of Agreement / Disagreement
Participants generally agree on the need to correct TikZ syntax errors, but there is no consensus on the best approach to shading the areas defined by the inequalities or the specific implementation details.
Contextual Notes
Some participants mention specific versions of PGF/TikZ, which may affect compatibility and functionality of the commands discussed.
Who May Find This Useful
Readers interested in LaTeX, TikZ graphics, and visual representation of mathematical concepts on the complex plane may find this discussion beneficial.