Understanding Hessian for multidimensional function

1 reply · 3K views · last reply
SaschaSIGI
Messages
3
Reaction score
0
Hello everybody,

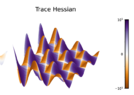
I have a question regarding this visualization of a multidimensional function. Given f(u, v) = e^{−cu} sin(u) sin(v). Im confused why the maximas/minimas have half positive Trace and half negative Trace. I thought because its maxima it only has to be negative. 3D vis

2D visualization
 
Attachments
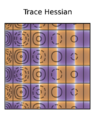
  • Contour plot titled Trace Hessian over a grid of cells, with solid and dashed closed contour rings colored orange and purple, showing the sign of the Hessian trace across the domain.
    hesse2.PNG
    37.7 KB · Views: 182
  • 3D surface plot titled Trace Hessian, a wavy grid of peaks and troughs coloured by a diverging scale from -10 (orange-brown) through 0 (white) to 10 (purple).
    hesse1.PNG
    39.1 KB · Views: 187
Hi,

You have me wondering what I am looking at. Is the Hessian projected as a color code on a plot of the function ?
Did it occur to you to write down the Hessian for this function ? So: what's the expression for the trace of the Hessian ? (*)

What do you mean with
SaschaSIGI said:
because its maxima it only has to be negative

Aren't there minima between the maxima ?

(by the way: single: minimum, maximum. Plural: minima, maxima)

(*) Notice the similarity with the Laplacian :smile: ?

##\ ##