Velocity from Acceleration-Time Graph

2 replies · 4K views · last reply
aatari
Messages
73
Reaction score
3
Hey Guys, I have attempted the solution and have attached the image. Would you guys please have a look and let me know if it is correct.

Thank you so much.

Homework Statement


Using the acceleration-time graph below, sketch the corresponding velocity- time graph. Show your work.
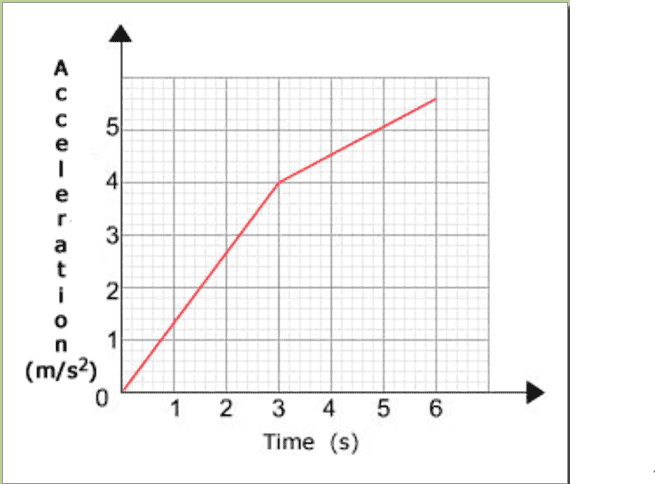
Acceleration versus time graph: a red line rises from 0 at t = 0 to 4 m/s² at t = 3 s, then continues rising more gently to about 5.5 m/s² at t = 6 s.


Homework Equations


None

The Attempt at a Solution


Handwritten student work on graph paper: an acceleration (m/s^2) against time (s) graph rising linearly from 0 to 4 m/s^2 at t = 3 s, then rising further to about 6 m/s^2 at t = 4 s with the region under the rising segment shaded, followed by lines of area calculations for each interval.
[/B]
 
In the third line from the bottom, you multiply 3 times 5.6. Shouldn't it be 3 times 1.6?

Edit: Also, did you consider integrating?
 
  • Like
Likes   Reactions: aatari
TomHart said:
In the third line from the bottom, you multiply 3 times 5.6. Shouldn't it be 3 times 1.6?

Edit: Also, did you consider integrating?
Yes you are right, it should be 1.6.