Vibrational Modes: How They Affect Motion
- Thread starter Kajan thana
- Start date
-
- Tags
- Modes
Click For Summary
Discussion Overview
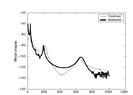
The discussion focuses on the concept of vibrational modes and their impact on motion, particularly in the context of a bimorph beam (PEH). Participants explore the interpretation of data related to vibrational modes, including predicted versus measured graphs.
Discussion Character
- Exploratory, Technical explanation, Conceptual clarification
Main Points Raised
- One participant seeks clarification on the test setup and whether the data is derived from accelerometer readings.
- Another participant mentions that the data pertains to a bimorph beam (PEH) and provides a link to a related resource.
- A participant expresses an understanding of vibrational modes and requests interpretation of a specific graph, noting that the "Predicted" graph likely comes from FEA tools while the "Measured" graph is based on acquired data.
- It is suggested that the MEMS arm was excited with a high mechanical impedance source while sweeping the frequency to generate the plot, drawing a parallel to plotting the transfer function of a 2-port network.
Areas of Agreement / Disagreement
Participants do not appear to reach a consensus on the interpretation of the graph or the specifics of the test setup, indicating that multiple viewpoints and uncertainties remain in the discussion.
Contextual Notes
There are limitations regarding the assumptions made about the data collection methods and the definitions of terms like "vibrational mode" and "high mechanical impedance source," which are not fully explored.
Similar threads
- · Replies 7 ·
- · Replies 4 ·
- · Replies 13 ·
- · Replies 4 ·
- · Replies 4 ·
- · Replies 0 ·