Visual proof log(ab) = log a + log b

  • Context:
  • Thread starter Thread starter Ppp1
  • Start date Start date
  • Tags Tags
    Log Proof Visual
Join the discussion
Registration is free. Ask a follow-up in this thread, or start your own.
7 replies · 7K views
Ppp1
Messages
4
Reaction score
0
Hi,

I'm looking for a visual proof log(ab) = log a + log b

I've seen diagrams where the values are measured out, but it's not immediately obvious why this holds. Is there an intuitive way to illustrate this? Also, are there other functions with this property.
 
Last edited by a moderator:
Mathematics news on Phys.org
Suppose we have:

$$y=\log_r(ab)$$

This is equivalent to:

$$ab=r^y$$

Now, this may be written as:

$$r^{\log_r(a)}\cdot r^{\log_r(a)}=r^y$$

Or:

$$r^{\log_r(a)+\log_r(b)}=r^y$$

And so equating exponents (and utilizing the one-to-one correspondence of the exponential function), we obtain:

$$y=\log_r(a)+\log_r(b)$$

Which means we conclude:

$$\log_r(ab)=\log_r(a)+\log_r(b)$$

As far as I know, only the logarithmic function has the property:

$$f(xy)=f(x)+f(y)$$
 
Nice, but very bourbaki ;)
Seems there is no immediate way to visualize this.
 
Let's start with the area under the curve $y=\frac 1x$ from $1$ to $a$.
That area is defined as $\color{red}\ln a$.
See the area marked in red.
\begin{tikzpicture}[scale=2]
\draw[->] (0,0) -- (4.4,0) node[above] {$x$-axis};
\draw[->] (0,0) -- (0,1.2) node
{$y$-axis};
\draw[red] (1,0) node[below] {$1$}
-- (1,1) node[above right] {$1$} [domain=1:1.8, variable=\x, ultra thick] plot ({\x}, {1/\x}) node
{$\frac 1a$}
-- (1.8,0) node[below] {$a$}
-- (1,0);
\node[red] at (1.4,0.35) {$\ln a$};
\end{tikzpicture}

Now suppose we multiply the x coordinates with $b$.
To keep the area the same, we need to divide the y coordinates by $b$.
The result is the following red area, which still has area $\color{red}\ln a$.
\begin{tikzpicture}[scale=2]
\draw[->] (0,0) -- (4.4,0) node[above] {$x$-axis};
\draw[->] (0,0) -- (0,1.2) node
{$y$-axis};
\draw[red] (1.6,0) node[below] {$b$}
-- (1.6,{1/1.6}) node[above right] {$\frac 1b$} [domain=1.6:2.88, variable=\x, ultra thick] plot ({\x}, {1/\x}) node
{$\frac 1{ab}$}
-- (2.88,0) node[below] {$ab$}
-- (1.6,0);
\node[red] at (2.24,0.25) {$\ln a$};
\end{tikzpicture}

Now we put the area belonging to $\color{blue}\ln b$ next to it in blue.
\begin{tikzpicture}[scale=2]
\draw[->] (0,0) -- (4.4,0) node[above] {$x$-axis};
\draw[->] (0,0) -- (0,1.2) node
{$y$-axis};
\draw[blue] (1,0) node[below] {$1$}
-- (1,1) node
{$1$} [domain=1:1.6, variable=\x, ultra thick] plot ({\x}, {1/\x})
-- (1.6,0)
-- (1,0);
\node[blue] at (1.3,0.35) {$\ln b$};
\draw[red] (1.6,0) node[below] {$b$}
-- (1.6,{1/1.6}) node[above right] {$\frac 1b$} [domain=1.6:2.88, variable=\x, ultra thick] plot ({\x}, {1/\x}) node
{$\frac 1{ab}$}
-- (2.88,0) node[below] {$ab$}
-- (1.6,0);
\node[red] at (2.24,0.25) {$\ln a$};
\end{tikzpicture}
The result is $\ln b + \ln a = \ln(ab)$.​
 
I like Serena said:
Let's start with the area under the curve $y=\frac 1x$ from $1$ to $a$...

Now that's clever. (Yes)
 
Nifty.
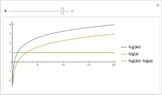
More basic, you could also argue multiplying the argument of a log just shifts the curve in the y-axis by the log of the multiplicator: log(b) = log(ab) - log(a), here with constant b = e, a on the x axis.
 

Attachments

  • log.jpg
    log.jpg
    11.7 KB · Views: 166
Ppp said:
Nifty.
More basic, you could also argue multiplying the argument of a log just shifts the curve in the y-axis by the log of the multiplicator: log(b) = log(ab) - log(a), here with constant b = e, a on the x axis.

The visual proof I gave corresponds to the definition of the logarithm and substitution:
$$
\ln a + \ln b \overset{\small\text{def}}= \int_1^a \frac {dx}x + \int_1^b \frac{du}u
= \int_1^a \frac {d(u/b)}{u/b} + \int_1^b \frac{du}u
= \int_b^{ab} \frac {du}{u} + \int_1^b \frac{du}u
= \int_1^{ab} \frac {du}{u}
\overset{\small\text{def}}= \ln(ab)
$$

How would that argument be a visual proof?
 
Well, to be precise, I didn't claim it was a rigorous proof ;) - it's more to gain intuition.