What do the gold loops and points represent in tornado path visualizations?

3 replies · 2K views · last reply
DaveC426913
Gold Member
2025 Award
Messages
24,760
Reaction score
9,181
TL;DR
A tornado swept through the town of Uxbridge Ontario last week. What does this data say?
Does anyone have a clue what the gold points and associated lines represent?

I notice that all the gold lines form closed loops (so they're not travel paths) and they cross themselves (so they're not contours).

I can't think of any type of data that would result in this.
ArcGIS web map of Uxbridge, Ontario showing gold loop-shaped lines and blue point markers over a grey street basemap, with a blue measurement line of 4,263.1 meters drawn across the town.


I've tried to follow up but I can't decipher the Twitterverse.
 
Attachments
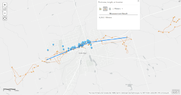
  • ArcGIS map of Uxbridge, Ontario, with grey streets, blue dots clustered along a blue measurement line, and thin orange looping lines around the area. A Find area, length, or location panel shows a measurement result of 4,263.1 Meters. Scale bar reads 0.64km.
    1654387054438.png
    29.3 KB · Views: 227
DaveC426913 said:
Summary: A tornado swept through the town of Uxbridge Ontario last week. What does this data say?

I can't think of any type of data that would result in this.
The blue dots apparently represent images taken from a drone.
Additional photos collected via drone for the May 21, 2022, Uxbridge, ON event. Ground survey conducted May 22, 2022.
But the path/file seem to be to the individual's computer.
 
Last edited:
In hindsight, I can see that several of closed loops have one leg that is long and straight. A drone racing home for 'Mission Completed' treats.
 
  • Haha
Likes   Reactions: Klystron and hutchphd