What Does the Graph of This Vector Equation Look Like?

  • Topic:
  • Thread starter ineedhelpnow
  • Start date
  • Tags Tags
    Vector
12 replies · 3K views · last reply
ineedhelpnow
Messages
649
Reaction score
0
sketch the plane curve with the given vector equation

$r(t)=e^{2t}$i $+e^{r}$j

what does the graph of this look like. is there any way to get a simple equation out of the two?
 
ineedhelpnow said:
sketch the plane curve with the given vector equation

$r(t)=e^{2t}$i $+e^{r}$j

what does the graph of this look like. is there any way to get a simple equation out of the two?
Can it be that the y-component should be $e^t$? :confused:

If so, suppose you define $x=e^{2t}$ and $y=e^t$.
What kind of relationship can you deduce from that? (Wondering)
 
oops. yeah the y component is e^t not e^r

- - - Updated - - -

$x=y^2$?
 
ineedhelpnow said:
oops. yeah the y component is e^t not e^r

- - - Updated - - -

$x=y^2$?

Yep! :D

What would the graph look like? (Wondering)
 
Attachments
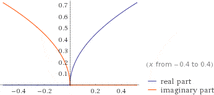
  • Plot of real and imaginary parts against x from -0.4 to 0.4: the real part (blue) is zero for x below 0 and rises from 0 for x above 0, while the imaginary part (orange) rises from 0 for x below 0 and is zero for x above 0.
    MSP982220ib93c4571g25e00000eca3402f9317713.gif
    3.6 KB · Views: 108
ineedhelpnow said:
https://www.physicsforums.com/attachments/3102

Hmm... what would be the meaning of that red line?
What kind of standard graph would it be anyway? (Wondering)
 
red line is imaginary. ignore that part. the blue part represents x=y^2
 
ineedhelpnow said:
red line is imaginary. ignore that part. the blue part represents x=y^2

Yeah right!

be-rational-get-real.png
 
dude come on... grow up (Giggle)

- - - Updated - - -

or should i say get real...
 
ineedhelpnow said:
https://www.physicsforums.com/attachments/3102

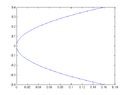
That's what I got,using matlab:

View attachment 3104

(Blush)
 
Attachments
  • MATLAB plot of a curve opening to the right, symmetric about the horizontal axis, with x from 0 to 0.16 and y from -0.4 to 0.4.
    matt.png
    1.8 KB · Views: 129
evinda said:
That's what I got,using matlab:

View attachment 3104

(Blush)

But... but... how can $y=e^t$ be negative?? :confused:

It does look like some standard graph, doesn't it? (Wondering)
 
I like Serena said:
But... but... how can $y=e^t$ be negative?? :confused:

It does look like some standard graph, doesn't it? (Wondering)

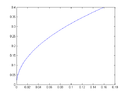
I tried it again.. (Wasntme)

View attachment 3105

Is it better now? (Blush)
 
Attachments
  • Plot of a single blue curve rising steeply from near (0, 0.02) and flattening as it goes up to (0.16, 0.4); x-axis from 0 to 0.18, y-axis from 0 to 0.4.
    matt.png
    1.6 KB · Views: 121
evinda said:
I tried it again.. (Wasntme)

https://www.physicsforums.com/attachments/3105

Is it better now? (Blush)

It's perfect! (Nod)