Re: Path
wheepep said:
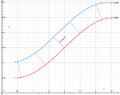
g(x) is a function which contains all points that are at a constant distance from f(x).
What is g(x) in terms of f(x)?
Hi wheepep! ;)
Suppose we look at the parametrized function $\gamma(t) = (t, f(t))$.
The tangent of a parametrized function is $\gamma'(t)$.
The normal is $\gamma'^\perp(t)$.
And the normal at unit length is $N(t) = \frac{\gamma'^\perp(t)}{\| \gamma'(t) \|}$.
So the function that is at constant distance $c$ is:
$$\gamma_c(t) = \gamma(t) + cN(t) = \gamma(t) + \frac{c\gamma'^\perp(t)}{\| \gamma'(t) \|}$$In your problem statement we have:
$$\gamma(x) = (x,f(x)) \\
\gamma'(x) = (1,f'(x)) \\
\gamma'^\perp(x) = (-f'(x),1) \\
N(t) = \left(-\frac{f'(x)}{\sqrt{1+f'(x)^2}}, \frac{1}{\sqrt{1+f'(x)^2}}\right) \\
\gamma_c(x) = \left(x-\frac{cf'(x)}{\sqrt{1+f'(x)^2}}, f(x) + \frac{c}{\sqrt{1+f'(x)^2}}\right)
$$
EDIT: Which is the same result MarkFL just gave! (Wink)If we (can) reparametrize the function $\gamma$ to $\tilde\gamma$ such that it has
unit speed, that is, has $\| \tilde\gamma'(s) \| = 1$, we have:
$$\tilde N(s) = \tilde\gamma'^\perp(s) \\
\tilde\gamma_c(s)=\tilde\gamma(s) + c\tilde\gamma'^\perp(s)
$$Let's pick an example.
Suppose we pick $\tilde\gamma(s) = (\cos s, \sin s)$, which corresponds to $f(x)=\sqrt{1-x^2}$, then it simplifies a bit:
$$\tilde \gamma'(s) = (-\sin s, \cos s) \\
\tilde N(s) = \tilde\gamma'^\perp(s) = (\cos s, \sin s)\\
\tilde\gamma_c(s) = \tilde\gamma s + c\tilde N(s) = (\cos s + c \cos s, \sin s + c \sin s) = (1+c)(\cos s, \sin s)
$$
which is a circle with radius $(1+c)$ as expected.
If we do the same thing with $f(x)=\sqrt{1-x^2}$ and $\gamma_c(x)=\left(x-\frac{cf'(x)}{\sqrt{1+f'(x)^2}}, f(x) + \frac{c}{\sqrt{1+f'(x)^2}}\right)$, we'll find the same result - it will just take
much longer.As you can see, the problem becomes much simpler if the function is a parametrized function at unit speed.
Of course it all depends on the function we want to shift.
Did you have any particular function in mind? (Wondering)