Why is my Earth orbit plot not elliptical in Maple?

3 replies · 2K views · last reply
incredibe1999
Messages
2
Reaction score
0
Hey there! I was trying to plot a ODE solution, but am not getting what I should be. It is actually plotting the orbit of Earth with Sun at the origin.
My equations
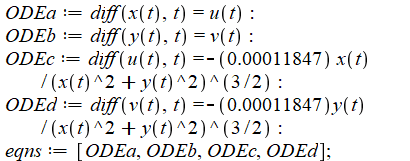
Maple code defining the system ODEa: diff(x(t),t) = u(t), ODEb: diff(y(t),t) = v(t), ODEc: diff(u(t),t) = -(0.00011847) x(t) / (x(t)^2 + y(t)^2)^(3/2), ODEd: diff(v(t),t) = -(0.00011847) y(t) / (x(t)^2 + y(t)^2)^(3/2), and eqns as the list of the four equations.

The (-0.00011847) is GM.
The Initial Conditions:
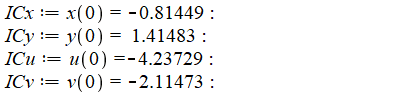
Maple worksheet lines setting initial conditions: ICx := x(0) = -0.81449, ICy := y(0) = 1.41483, ICu := u(0) = -4.23729, ICv := v(0) = -2.11473.


The plot I get:
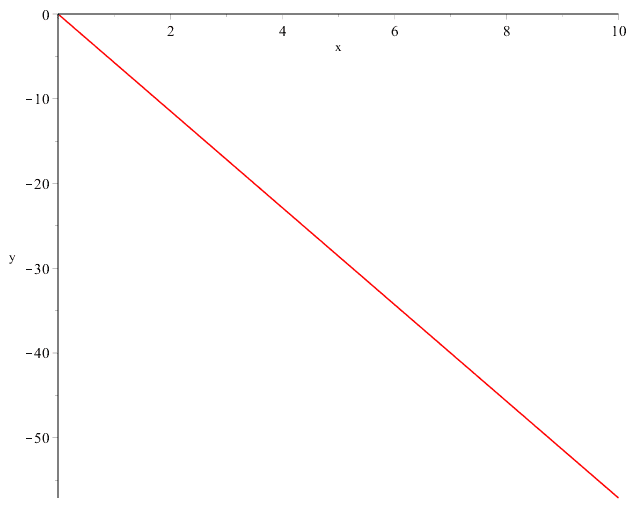
Maple plot of a straight red line running from the origin down to the lower right, with x axis from 0 to 10 and y axis from 0 to about -55.

Should not I be getting a elliptic/circular plot as the orbital positions of the Earth? Also, here the period is t=1. The position is supposed to be same at t=0 and t=1. Help, please!
 
Attachments
  • Maple code defining the system ODEa: diff(x(t),t) = u(t), ODEb: diff(y(t),t) = v(t), ODEc: diff(u(t),t) = -(0.00011847) x(t) / (x(t)^2 + y(t)^2)^(3/2), ODEd: diff(v(t),t) = -(0.00011847) y(t) / (x(t)^2 + y(t)^2)^(3/2), and eqns as the list of the four equations.
    upload_2018-4-5_18-53-13.png
    4 KB · Views: 1,166
  • Maple worksheet lines setting initial conditions: ICx := x(0) = -0.81449, ICy := y(0) = 1.41483, ICu := u(0) = -4.23729, ICv := v(0) = -2.11473.
    upload_2018-4-5_18-54-10.png
    2.2 KB · Views: 1,106
  • Maple plot of a straight red line running from the origin down to the lower right, with x axis from 0 to 10 and y axis from 0 to about -55.
    upload_2018-4-5_18-54-28.png
    3.4 KB · Views: 779
scottdave said:
What is the code you used to generate this plot?
I used the ODE Analyzer.
 
Well, that is not very helpful for us in finding out what goes wrong.

If I use your picture (please post something one can copy as text next time -- it avoids typos) but take different values, even good old Euler in Excel gets me a plot I expect:

Plot of a closed, slightly non-circular orbit in the x-y plane with axes from -1.5 to 1.5; the curve passes near (0, 1), (-1, 0) and (0, -1.1) and ends with a short gap near (1, -0.45).


values:
Code:
dt 0,01
x_0 1
y_0 0
vx_0 0
vy_0 1
GM 1
so the expressions look OK (provided I reproduced them correctly)

Now: what are the units for your values (and for time) ?
 
Attachments
  • Plot of a closed, slightly non-circular orbit in the x-y plane with axes from -1.5 to 1.5; the curve passes near (0, 1), (-1, 0) and (0, -1.1) and ends with a short gap near (1, -0.45).
    upload_2018-4-8_12-59-20.png
    6.5 KB · Views: 721