Discussion Overview
The discussion revolves around how to plot two functions simultaneously in Mathematica, specifically addressing the syntax and methods for achieving this. Participants explore different approaches to visualize the functions on the same screen, including using built-in plotting functions and online alternatives.
Discussion Character
- Technical explanation
- Homework-related
Main Points Raised
- One participant seeks to recall the correct Mathematica code to plot a function defined as F(x) = f(qi)/f(bn) for varying indices i and n.
- Another participant suggests multiple methods for plotting, including using GraphicsRow and GraphicsColumn for side-by-side or stacked plots, respectively.
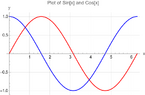
- A specific example is provided using the functions Sin[x] and Cos[x] to demonstrate how to plot both functions on the same graph with appropriate styling and labels.
- One participant notes they do not have Mathematica to test the provided example, indicating uncertainty about its functionality.
- Another participant mentions Wolfram Cloud as a free online alternative to Mathematica for those without access to the software.
- A participant expresses gratitude for verification of their code snippet by another user.
Areas of Agreement / Disagreement
Participants generally agree on the methods to plot functions in Mathematica, but there is no consensus on the initial query regarding the specific formulation of F(x) as it relates to the indices. Some uncertainty remains about the effectiveness of the provided solutions due to lack of testing.
Contextual Notes
Limitations include the lack of testing of the proposed code snippets by some participants, which may affect confidence in their applicability. The original function definition and its implications for plotting remain somewhat unclear.
Who May Find This Useful
This discussion may be useful for Mathematica users looking to plot multiple functions, as well as those interested in online alternatives for function visualization.