Calculating Average Emission Wavelength from Spectral Intensity Chart

Join the discussion
Registration is free. Ask a follow-up in this thread, or start your own.
9 replies · 6K views
Xtensity
Messages
103
Reaction score
0
I haven't had calculus in over 2 years and so I am not exactly sure how to go about this. I am inclined to believe some form of integration would be needed.

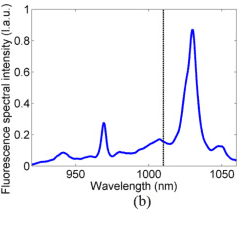
I took the chart below from a paper on LED wavelength emission. The authors say that the vertical line represents the average emission wavelength. If say hypothetically I had a function to represent this graph, how would I go about finding this "average emission wavelength"? What is the process?
RxQBrq4.png
 
Physics news on Phys.org
I believe that you want to find the wavelength such that the area of the function with wavelengths shorter than the average is equal to the area of the function with wavelengths greater.
So if our function is on the interval [a,b], then we want [itex]\mu[/itex] to be chosen such that

[tex]\int_a^{\mu}f(x)dx=\int_{\mu}^b f(x)dx[/tex]

However, the area on the right side seems larger than the left in the graph you posted, so I'm not certain. The answer to your problem could even be as simple as taking the average value of the shortest wavelength and longest wavelengths registered.
 
Mentallic said:
I believe that you want to find the wavelength such that the area of the function with wavelengths shorter than the average is equal to the area of the function with wavelengths greater.
That would be the median.

The average is defined as
$$\mu = \frac{\int_a^b x f(x)dx }{ \int_a^b f(x)dx }$$
and the indicated value looks reasonable.
 
mfb said:
That would be the median.
Actually no, it wouldn't be that either.

mfb said:
The average is defined as
$$\mu = \frac{\int_a^b x f(x)dx }{ \int_a^b f(x)dx }$$
and the indicated value looks reasonable.
Oh yes that makes sense!
 
If it were the median, then that would be assuming that the intensity of each wavelength of light would be constant, would it not?
 
Consider a light bulb that emits photons only in the visible light spectrum and cuts off abruptly before delving into the infrared and ultra-violet territory. But most of the photons being produced are of the shorter blue light wavelengths, producing what we consider to be a blue light bulb. The median photon would then be found closer to the blue end of the spectrum than the average of the max and min photons wavelengths.

Now just extend this concept to a continuous stream of wavelengths as in the OP, but with varying intensity.
 
Yes, where is the problem? The median is always defined at the point where 50% of the distribution is larger and 50% is smaller. This can differ from the average. We see this in post 1: the indicated line is the average, not the median.
 
Ugh... I made the mistake of thinking that you replied to my second guess that it could be the average of the shortest and longest wavelength. Sorry about wasting your time mfb.