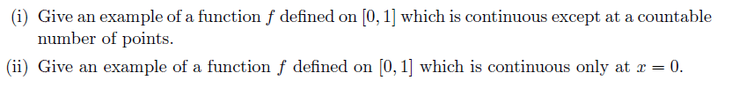
Can I Find Examples for Continuous Improvement?

  • MHB
  • Thread starter Joe20
  • Start date
  • Tags
    Continuous
In summary, continuous data refers to data that can take on any value within a range and is not limited to specific values, such as the height of a person. It is different from discrete data, which is limited to specific values. Other examples of continuous data include time, temperature, and distance. This type of data is typically represented graphically using line graphs or histograms. Understanding continuous data is crucial in scientific research as it allows for more accurate representation and analysis of the data.
  • #1
Joe20
53
1
Need help for the two parts! Thanks!
 

Attachments

  • 222.png
    222.png
    7.6 KB · Views: 53
Physics news on Phys.org
  • #2
Please share your thoughts on the problem. What examples have you tried that failed?
 
  • #3


Hi there! Can you provide more information about what you need help with? It would be helpful to know what the two parts are and what specific assistance you are looking for. Also, please let us know if you have any specific deadlines or requirements. Thank you!
 

What is an example of continuous data?

An example of continuous data is the height of a person, as it can take on any value within a range and is not limited to specific values.

How is continuous data different from discrete data?

Continuous data is data that can take on any value within a range, while discrete data is limited to specific values. For example, the number of students in a classroom is discrete data as it can only be a whole number, while the weight of a student is continuous data as it can be any value within a range.

What are some other examples of continuous data?

Some other examples of continuous data include time, temperature, and distance. These variables can take on any value within a range and are not limited to specific values.

How is continuous data represented graphically?

Continuous data is typically represented graphically using a line graph or a histogram. This allows for the visualization of the data over a continuous range of values.

What is the importance of understanding continuous data in scientific research?

Understanding continuous data is important in scientific research as it allows for a more accurate representation of the data and can provide more precise insights. It also allows for the use of statistical analysis to draw conclusions and make predictions based on the data.

Similar threads

  • Topology and Analysis
Replies
5
Views
2K
  • Topology and Analysis
Replies
18
Views
2K
Replies
10
Views
1K
  • Topology and Analysis
Replies
4
Views
1K
  • Topology and Analysis
Replies
5
Views
1K
Replies
3
Views
1K
  • Topology and Analysis
Replies
2
Views
2K
  • Topology and Analysis
Replies
3
Views
1K
Replies
1
Views
1K
Replies
2
Views
2K
Back
Top