Comparing Near-Infrared Spectra: What Stat Method?

Join the discussion
Ask a follow-up here, or get your own question answered by working scientists, mathematicians and engineers — people, not an autocomplete.
Real named experts · corrections over time · the nuance an AI answer skips
5 replies · 2K views
groot44
Messages
6
Reaction score
2
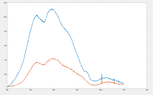
I'd like to compare 2 or more near-infrared spectra. The data consists of measured light intensity in different wavelengths (range 600 nm to 1100 nm).

I'm wondering which statistical method would be appropriate? I noticed when searching online that pearson correlation might be inaccurate as it's used for linear correlation. However, when experimenting with MATLAB's function corrcoef, I get pretty accurate results when comparing visually spectra. But still unsure if some other method would be better in this case so thoughts on the matter would be highly appreciated, thanks!

Attached example of the data to be compared.
 

Attachments

  • Screenshot 2021-09-17 at 10.45.11.png
    Screenshot 2021-09-17 at 10.45.11.png
    7.8 KB · Views: 190
Biology news on Phys.org
groot44 said:
I'd like to compare 2 or more near-infrared spectra.
What do you mean by "compare" in this context? What would the comparison say about the signals?
 
Reply
  • Like
Likes   Reactions: groot44
Dale said:
What do you mean by "compare" in this context? What would the comparison say about the signals?

Good question. I’d like to compare the shape of spectra. Comparison would say in this context how similar the shapes of the spectra are.
 
I assume each spectrum is background subtracted when taken.
My first attempt would be to narrowly as possible define the wavelength region of interest and normalize each curve to that region. Look at the results. If you want a single number for compare, the RMS summed deviation is then convenient. How clever do you need to be?
 
groot44 said:
Good question. I’d like to compare the shape of spectra. Comparison would say in this context how similar the shapes of the spectra are.
I don't know too much about shape metrics. Here is a paper about shape similarity measures:

https://citeseerx.ist.psu.edu/viewd...measure between,parts of both compared shapes.

Once you have computed the appropriate shape metric then you could do a standard statistical measurement like the t-test to see if the difference in shapes according to these metrics is significantly different from zero.

Alternatively, if you have some model of the shape of the spectra then you could fit each spectrum to the model and get some confidence intervals for the parameters. Then you could check for similarity by comparing the parameters.
 
Reply
  • Like
Likes   Reactions: jim mcnamara and hutchphd
groot44 said:
I'm wondering which statistical method would be appropriate? I noticed when searching online that pearson correlation might be inaccurate as it's used for linear correlation.
In your data, you expect to see a linear correlation between the spectra of the two compounds. For wavelengths, where you see high absorbance for the first compound, you expect to see high absorbance for the second compound and vice versa for wavelengths were you see low absorbance for the first compound. The absorbance is not linearly correlated with wavelength, but that doesn't matter as you're measuring the correlation between the absorbance of two compounds. (Nevertheless, whenever calculating the correlation coefficient, it's always helpful to make a scatterplot of the data to see whether the relationship is linear or more complicated).
 
Reply
  • Like
Likes   Reactions: jim mcnamara