Creating Circular Image Plots with Transparency in MATLAB

Join the discussion
Registration is free. Ask a follow-up in this thread, or start your own.
5 replies · 11K views
mikeph
Messages
1,229
Reaction score
18
Hi,

Just came across this as an image in a book/monograph and it looks very MATLAB-esque, except I cannot figure out how to possibly create a circular image
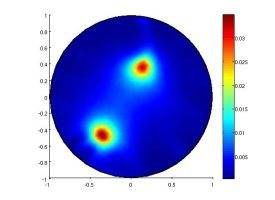
fig6.4r.jpg


Say I have a 500x500 matrix and want to plot it as a colour image in this way. Does anyone know how? I've been re-reading the same help files again and again with no progress.
 
Physics news on Phys.org
Thanks for the reply, I don't fully understand how to apply it to my problem (never been strong on plot tools), my image has no coordinates, it's just a 500x500 matrix. I don't need the axis, just for the plotter to not plot anything outside a circular region. Currently I'm using pcolor with "EdgeAlpha" to zero so it looks very similar to that image I linked, but it's a square.
 
Hi, just need to bump this, I still don't understand how to do this.
 
One more bump, I still can't find an answer, thanks

I really just need to know how to make the non-circle area white, at the moment I'm fiddling around with colour maps and manually changing the values to force it to look white, but it has side-effects.
 
Last edited:
Bumping to say I solved the problem.

The solution lies in the alpha data of the object.

For example you can use a ROI to make part of the object transparent, using

set(gco,'AlphaDataMapping','scaled','AlphaData',ROI)

Where ROI = 1 the image will stay opaque and where it is 0 the image will be transparent.