lost captain
- 89
- 7
Let's say i want to find the change in enthalpy of air from 400K to 800K.
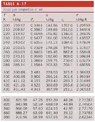
The most accurate way is to use the table A-17.(see picture)
"Find the table that has the enthalpy changes from a random reference temperature to find the enthalpy change as the difference between enthalpies."
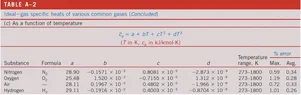
Now the second option and less accurate than the 1st one, is using table A-2
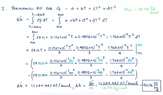
"Find the polynomial coefficients and carry out the integral."
My question is why these two results aren't the same? The first is 420.97 kJ/kg and the second comes out as 422.66 kJ/kg .
In the second option, If I'm integrating then I'm taking into account that cp changes with temperature, so shouldn't this value be found both by the second method and the first?
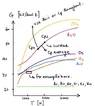
Obviously that doesn't happen, so that leaves me wondering how are the values in table A-17 calculated? I falsely thought that they came from integration from the diagram cp-Temperature.
This question came to me after watching this video:
The pictures are also screenshot from that video.
Thanks in advance for anyone taking the time answering

The most accurate way is to use the table A-17.(see picture)
"Find the table that has the enthalpy changes from a random reference temperature to find the enthalpy change as the difference between enthalpies."
Now the second option and less accurate than the 1st one, is using table A-2
"Find the polynomial coefficients and carry out the integral."
My question is why these two results aren't the same? The first is 420.97 kJ/kg and the second comes out as 422.66 kJ/kg .
In the second option, If I'm integrating then I'm taking into account that cp changes with temperature, so shouldn't this value be found both by the second method and the first?
Obviously that doesn't happen, so that leaves me wondering how are the values in table A-17 calculated? I falsely thought that they came from integration from the diagram cp-Temperature.
This question came to me after watching this video:
The pictures are also screenshot from that video.
Thanks in advance for anyone taking the time answering
Attachments