Cassius1n
- 13
- 0
I have finsihed my work on an orbit propagator in MATLAB and now I'm trying to simulate the orbit with the help of the main script.
tspan=[0 :860];
Position and velocity
y0(1,1)= 743322.3616 ;
y0(2,1)= -6346021.219 ;
y0(3,1)= -3394131.349 ;
y0(4,1)= 5142.38067;
y0(5,1)= 4487.44895 ;
y0(6,1)= -7264.00872;
%%%% Mass(kg) /surface(m^2)
m = 217 ; %320;
A = 1.2; %8;
%%%% RK4
h=1;
y = zeros(6, tspan(end)/h);
y(:,1) = y0;
for i=1:1:(tspan(end)/h)
H=sqrt(y(1,i)^2+y(2,i)^2+y(3,i)^2);
k_1 = proiectia(tspan(i), y(:,i), H, m, A, y(4:6, i));
k1=k_1;
k_2 = proiectia(tspan(i)+0.5*h, y(:,i)+0.5*h*k_1, H, m, A, y(4:6, i));
k2=k_2;
k_3 = proiectia((tspan(i)+0.5*h), (y(:,i)+0.5*h*k_2), H, m, A, y(4:6, i));
k3=k_3;
k_4 = proiectia((tspan(i)+h),(y(:,i)+k_3*h), H, m, A, y(4:6, i));
k4=k_4;
y(:,i+1) = (y(:,i) + (1/6)*(k1+2*k2+2*k3+k4)*h);
plot3(y(1,:),y(2,:),y(3,: ));
drawnow
end
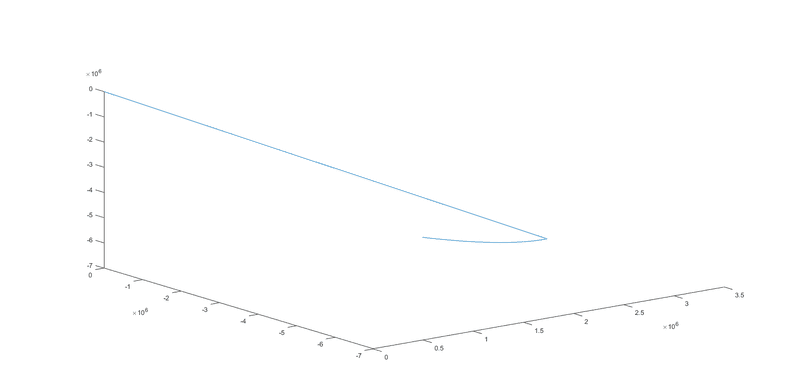
The orbit is well described but it keeps drawing an extra line from 0 to where the point(x,y,z) is .After all the values are being represented, the line from 0 dissapears and it only remains the curved line(the orbit). Does anyone have any ideea why does it plot that line from 0 while is on the Runge Kutta loop?
tspan=[0 :860];
Position and velocity
y0(1,1)= 743322.3616 ;
y0(2,1)= -6346021.219 ;
y0(3,1)= -3394131.349 ;
y0(4,1)= 5142.38067;
y0(5,1)= 4487.44895 ;
y0(6,1)= -7264.00872;
%%%% Mass(kg) /surface(m^2)
m = 217 ; %320;
A = 1.2; %8;
%%%% RK4
h=1;
y = zeros(6, tspan(end)/h);
y(:,1) = y0;
for i=1:1:(tspan(end)/h)
H=sqrt(y(1,i)^2+y(2,i)^2+y(3,i)^2);
k_1 = proiectia(tspan(i), y(:,i), H, m, A, y(4:6, i));
k1=k_1;
k_2 = proiectia(tspan(i)+0.5*h, y(:,i)+0.5*h*k_1, H, m, A, y(4:6, i));
k2=k_2;
k_3 = proiectia((tspan(i)+0.5*h), (y(:,i)+0.5*h*k_2), H, m, A, y(4:6, i));
k3=k_3;
k_4 = proiectia((tspan(i)+h),(y(:,i)+k_3*h), H, m, A, y(4:6, i));
k4=k_4;
y(:,i+1) = (y(:,i) + (1/6)*(k1+2*k2+2*k3+k4)*h);
plot3(y(1,:),y(2,:),y(3,: ));
drawnow
end
The orbit is well described but it keeps drawing an extra line from 0 to where the point(x,y,z) is .After all the values are being represented, the line from 0 dissapears and it only remains the curved line(the orbit). Does anyone have any ideea why does it plot that line from 0 while is on the Runge Kutta loop?
