Dustinsfl
- 2,217
- 5
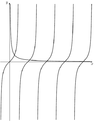
How can I get Tikz to produce this, tanx = 1/x, graph from [0,10\pi]?
Evgeny.Makarov said:What do you mean by a graph of an equation? Do you want to draw the graphs of tan(x) and 1/x on that interval? See section 19.5 of the manual for v. 2.10. I am not sure how tan(x) would behave across the vertical asymptotes. It may be necessary to draw it on each interval $(-\pi/2+k\pi,\pi/2+k\pi)$ separately using the foreach command. You may need to reduce each interval or use the clip command to limit the graph vertically
 \usetikzlibrary{arrows}
  \begin{tikzpicture}[>=stealth',x=.5cm,y=.5cm]
 \def\npi{3.1416}
 \def\periods{4}
 \draw[->] (-\npi/2,0) -- ({(\periods+.5)*\npi},0) node[below] {$x$};
 \draw[->] (0,-10) -- (0,10) node[left] {$y$};
 \clip (-\npi/2,-9.8) rectangle ({(\periods+.5)*\npi},9.8);
 \draw[thick,domain=0.05:{(\periods+.4)*\npi},samples=300,smooth] plot (\x,1/\x);
 \foreach \n in {0,...,4}
 \draw[thick,shift={(\npi*\n,0)},domain=-\npi/2+.1:\npi/2-.1,samples=100,smooth] plot (\x,{tan(\x r)});
\end{tikzpicture}Is there a command to tell it to label every pi/2 on the graph?Evgeny.Makarov said:Code:\usetikzlibrary{arrows} \begin{tikzpicture}[>=stealth',x=.5cm,y=.5cm] \def\npi{3.1416} \def\periods{4} \draw[->] (-\npi/2,0) -- ({(\periods+.5)*\npi},0) node[below] {$x$}; \draw[->] (0,-10) -- (0,10) node[left] {$y$}; \clip (-\npi/2,-9.8) rectangle ({(\periods+.5)*\npi},9.8); \draw[thick,domain=0.05:{(\periods+.4)*\npi},samples=300,smooth] plot (\x,1/\x); \foreach \n in {0,...,4} \draw[thick,shift={(\npi*\n,0)},domain=-\npi/2+.1:\npi/2-.1,samples=100,smooth] plot (\x,{tan(\x r)}); \end{tikzpicture}
gives
View attachment 355
For a better quality, it may make sense to use gnuplot to compute the coordinates as described in the TikZ manual.
No, you'll need to do this using the \foreach command. I believe this was discussed in a recent thread.dwsmith said:Is there a command to tell it to label every pi/2 on the graph?
\foreach \x in {0,\pi/2,...,5\pi}
\draw (\x,0) n\pi/2 (0.5cm);%draw the ticks
\foreach \x in {1,...,10} \draw (\x*\npi/2,2pt) -- (\x*\npi/2,-2pt);
%draw labels n\pi/2 for odd n >= 3
\foreach \x in {3,5,...,9} \node[below] at (\x*\npi/2,0) {$\frac{\x\pi}{2}$};
%draw labels n\pi for n >= 2
\foreach \x in {2,...,5} \node[below] at (\x*\npi,0) {$\x\pi$};
\node[below] at (\npi/2,0) {$\frac{\pi}{2}$};
\node[below] at (\npi,0) {$\pi$};\foreach \x/\xtext in {1/\frac{\pi}{2},2/\pi,3/\frac{3\pi}{2},4/2\pi} {
\draw (\x*\npi/2,2pt) -- (\x*\npi/2,-2pt);
\node at (\x*\npi/2,0) {$\xtext$};
}Evgeny.Makarov said:I have not tested this code.
Code:%draw the ticks \foreach \x in {1,...,10} \draw (\x*\npi/2,2pt) -- (\x*\npi/2,-2pt); %draw labels n\pi/2 for odd n >= 3 \foreach \x in {3,5,...,9} \node[below] at (\x*\npi/2,0) {$\frac{\x\pi}{2}$}; %draw labels n\pi for n >= 2 \foreach \x in {2,...,5} \node[below] at (\x*\npi,0) {$\x\pi$}; \node[below] at (\npi/2,0) {$\frac{\pi}{2}$}; \node[below] at (\npi,0) {$\pi$};
It is also possible to use one \foreach, but since the labels are slightly different, I am not sure about ellipses. All labels may need to be given explicitly.Code:\foreach \x/\xtext in {1/\frac{\pi}{2},2/\pi,3/\frac{3\pi}{2},4/2\pi} { \draw (\x*\npi/2,2pt) -- (\x*\npi/2,-2pt); \node at (\x*\npi/2,0) {$\xtext$}; }
dwsmith said:If I add (0.25cm), will it adjust the text size?
First, \pi is a predefined command in TeX. Second, the \foreach command is both powerful and fickle. I am not sure it can recognize the pattern in 0,\pi/2,...,5\pi. The safest way is to (1) give all variants explicitly, separated by commas, (2) iterate over natural numbers, as in \foreach \x in {1, ..., 10} or (3) iterate over natural numbers with a given step, as in \foreach \x in {1,3, ..., 9}. Then you can use \x in an arithmetic expression inside a coordinate. For more information, see the section about \foreach (I believe it is in the chapter about utilities).dwsmith said:Code:\foreach \x in {0,\pi/2,...,5\pi}
To print text, use eitherdwsmith said:Code:\draw (\x,0) n\pi/2 (0.5cm);